Speed of sound using Phyphox

You can get encouragingly accurate values for the speed of sound in the school laboratory using a tape measure and two smartphones (or tablets) running the Phyphox app.

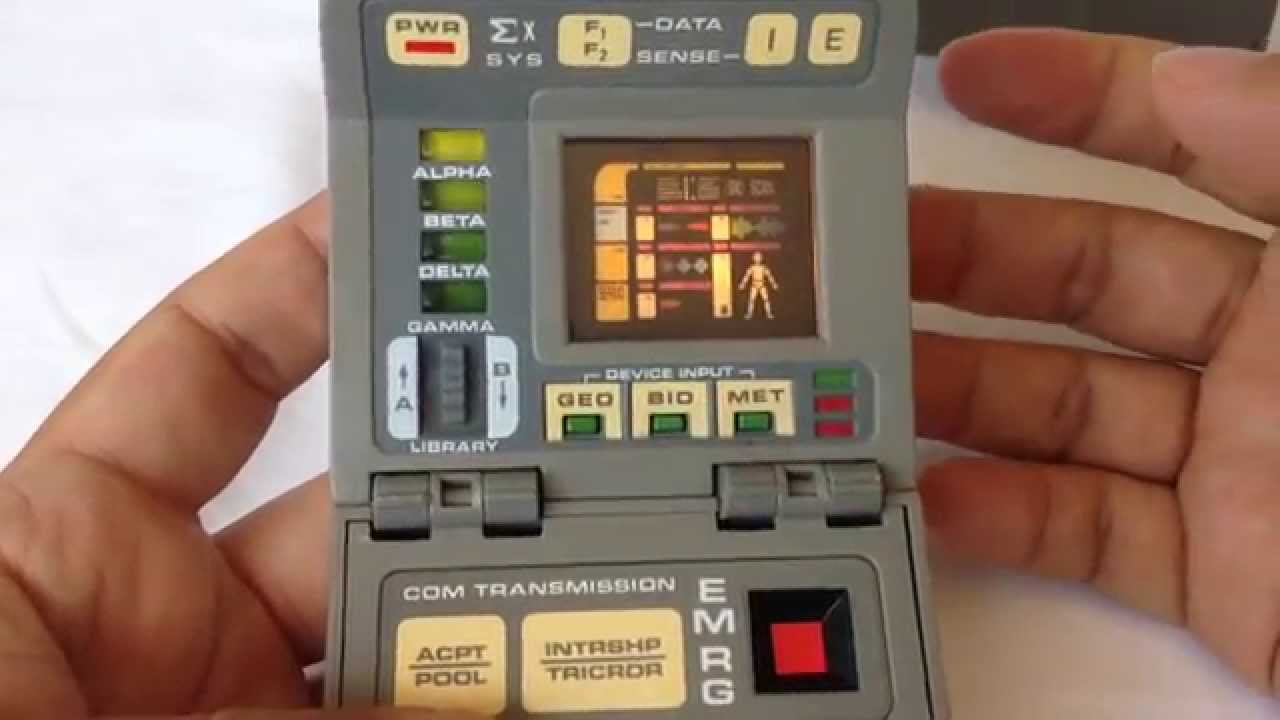
Phyphox (pronounced FEE-fox) is an award-winning free app that was developed by physicists at Aachen University who wanted to give users direct access to the many sensors (e.g. accelerometers and magnetometers) which are standard features on many smartphones. In effect, it turns even the humblest smartphone or tablet into a multifunctional measuring instrument comparable to one of Star Trek’s famous ‘tricorders’.

Star Trek Tricorder (not Phyphox)

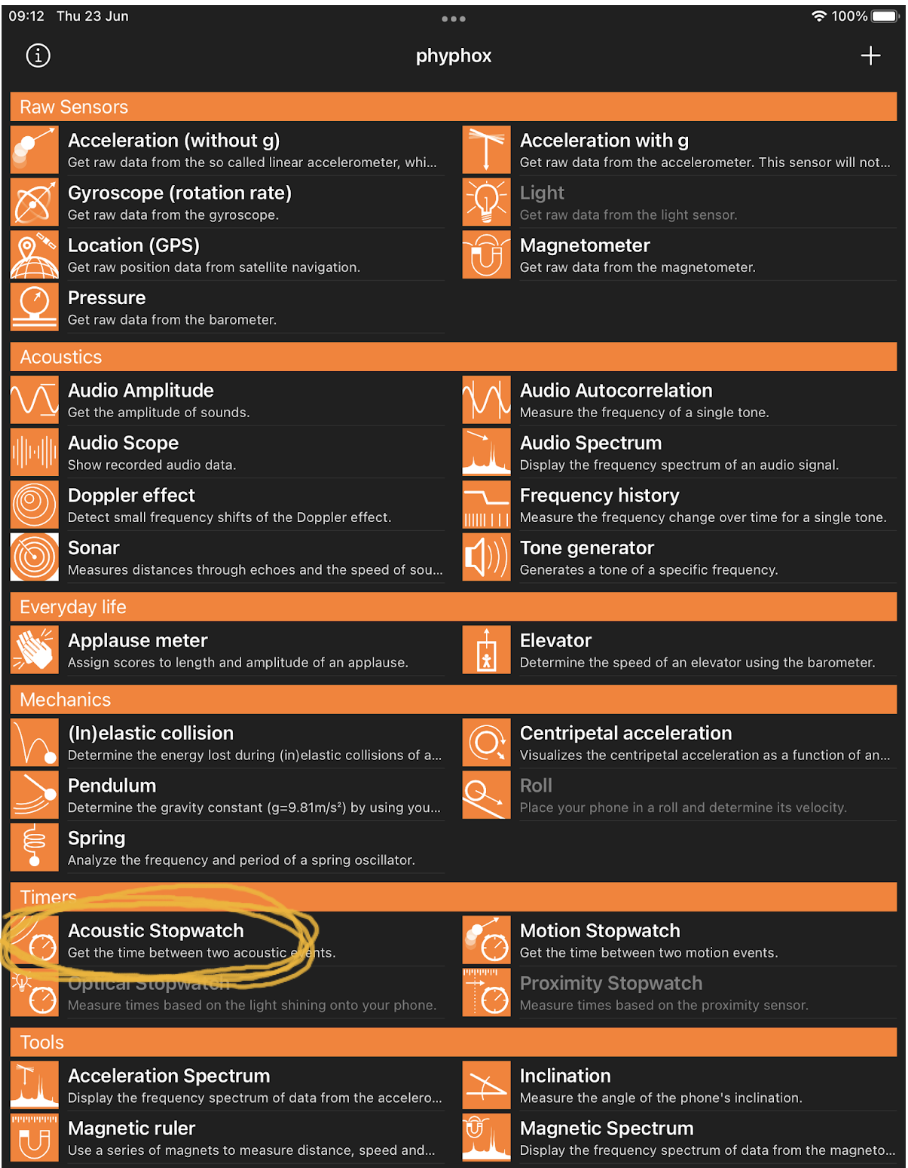
To measure the speed of sound, we need two smartphones or tablets running Phyphox. We will be using the ‘Acoustic Stopwatch’ which measures the time between two acoustic events.

Phyphox main screen

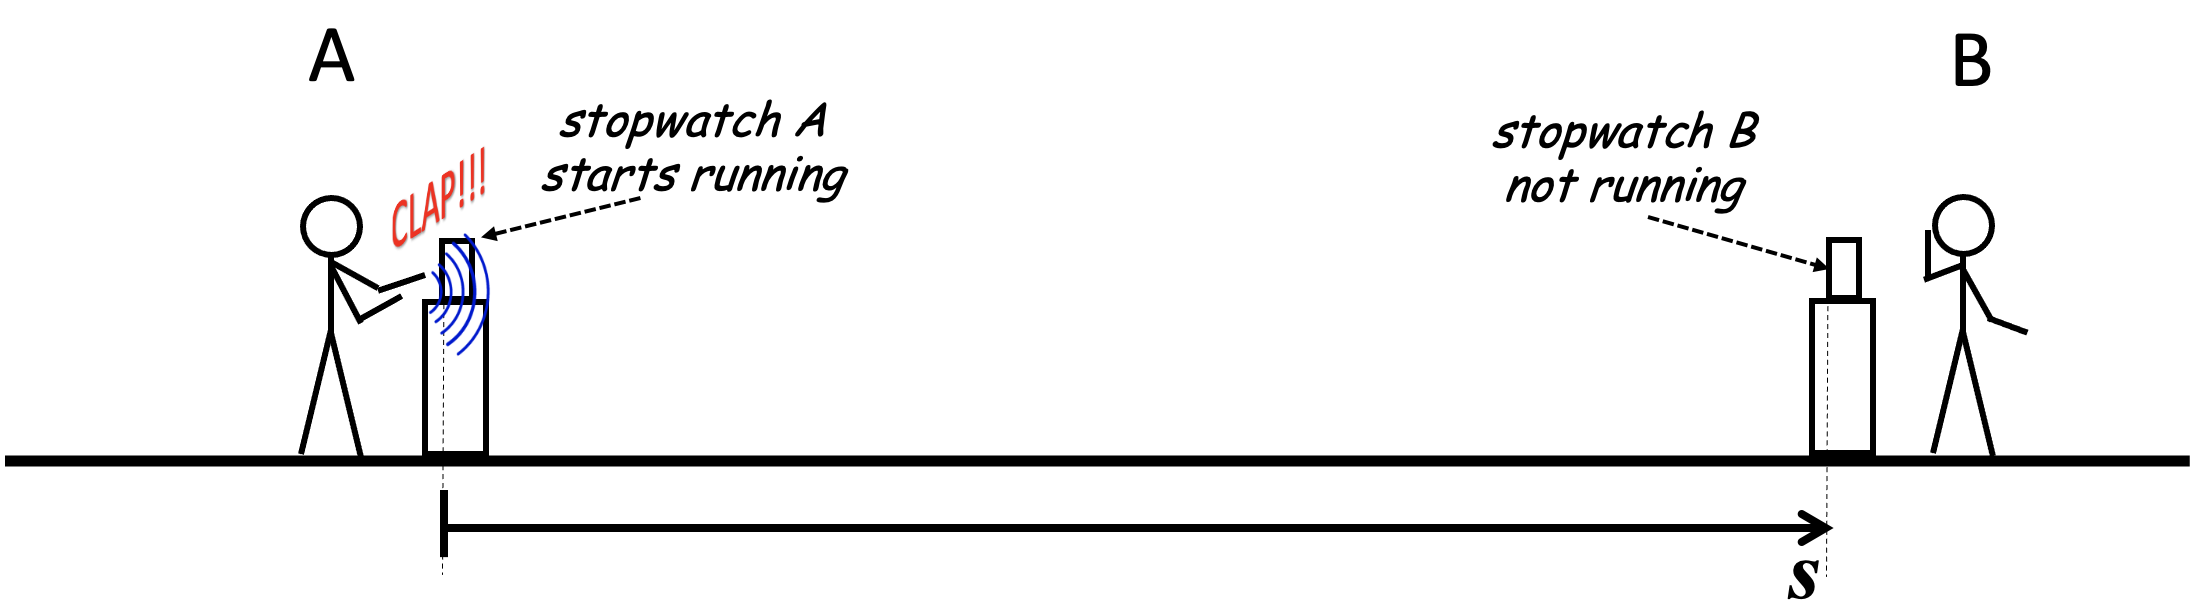
Step 1: Place two devices a measured distance s apart. Typically about 2 or 3 m should be OK otherwise the sound made by A will not be loud enough to control stopwatch B — this can be established through trial and error and depends on many factors including the background noise level.

Step 2: Person A makes a loud sound (a clap or a single syllable shout like ‘Hey!’ is good).

Step 3: Person B and stopwatch B wait for sound created by A to reach them.
Step 4: The sound reaches stopwatch B and starts it running and B hears the sound.

Step 5: B makes a loud sound in response.

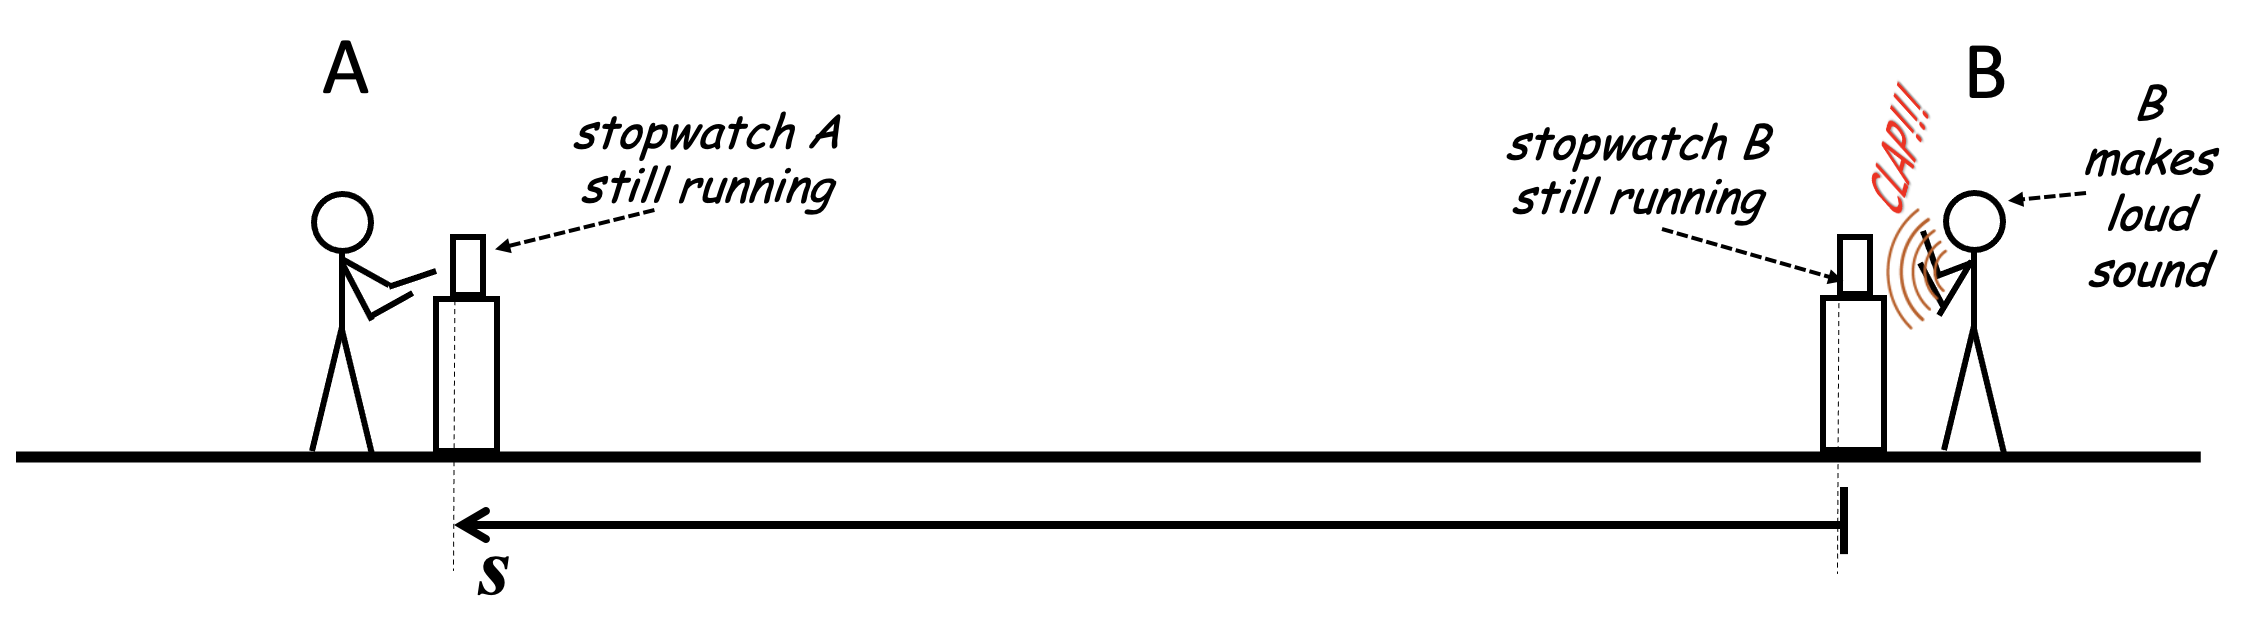
Step 6: The loud sound made by B reaches stopwatch B and makes it stop. Let’s call the time displayed tB. This measures the delay between the sound from A reaching stopwatch B and B reacting to the sound and stopping the clock. It includes the time taken for the initial sound travelling from the device to B, B’s reaction time, and the time taken for the sound made by B to travel to stopwatch B. B does not have to be particularly ‘quick off the mark’ to respond to A’s sound — although the shorter the time then the less likely it is then a background noise will interrupt the experiment.

Step 7: The sound made by B travels toward stopwatch A.

Step 8: The sound made by B reaches stopwatch A and makes it stop. Let’s call the time recorded on stopwatch A tA.

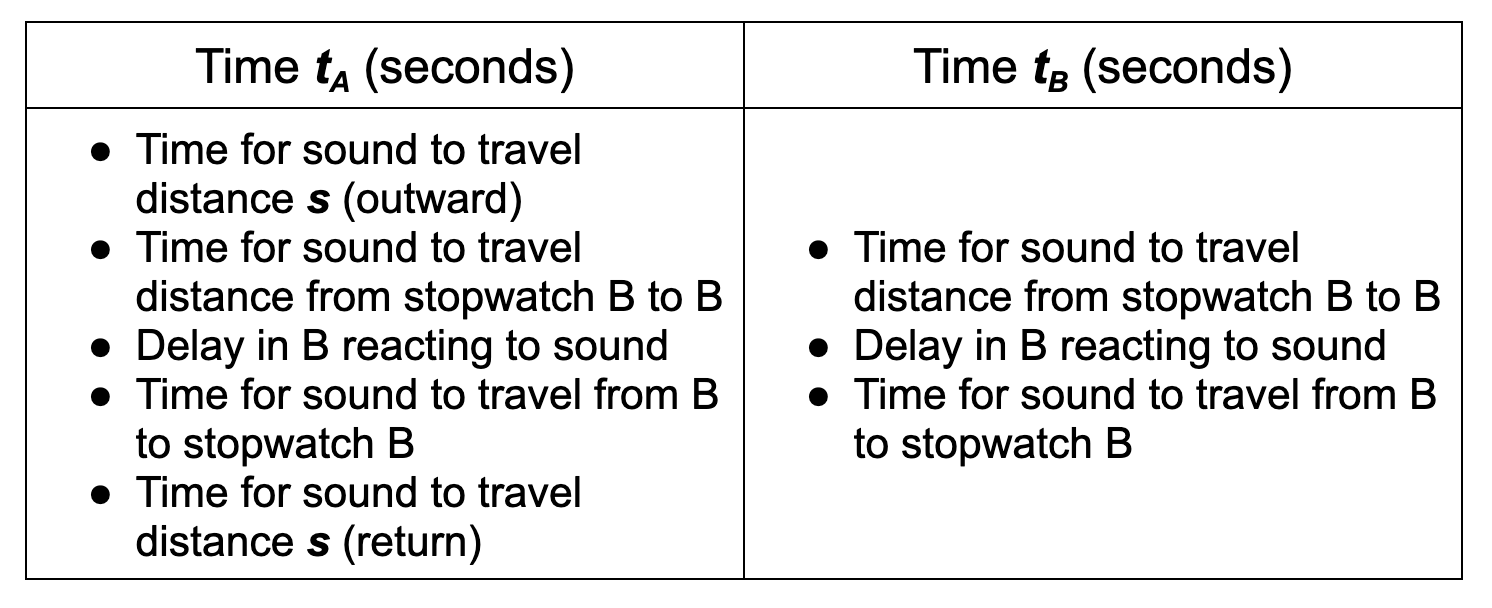
If we break down the events included in tA and tB, we find that tA is always larger than tB:
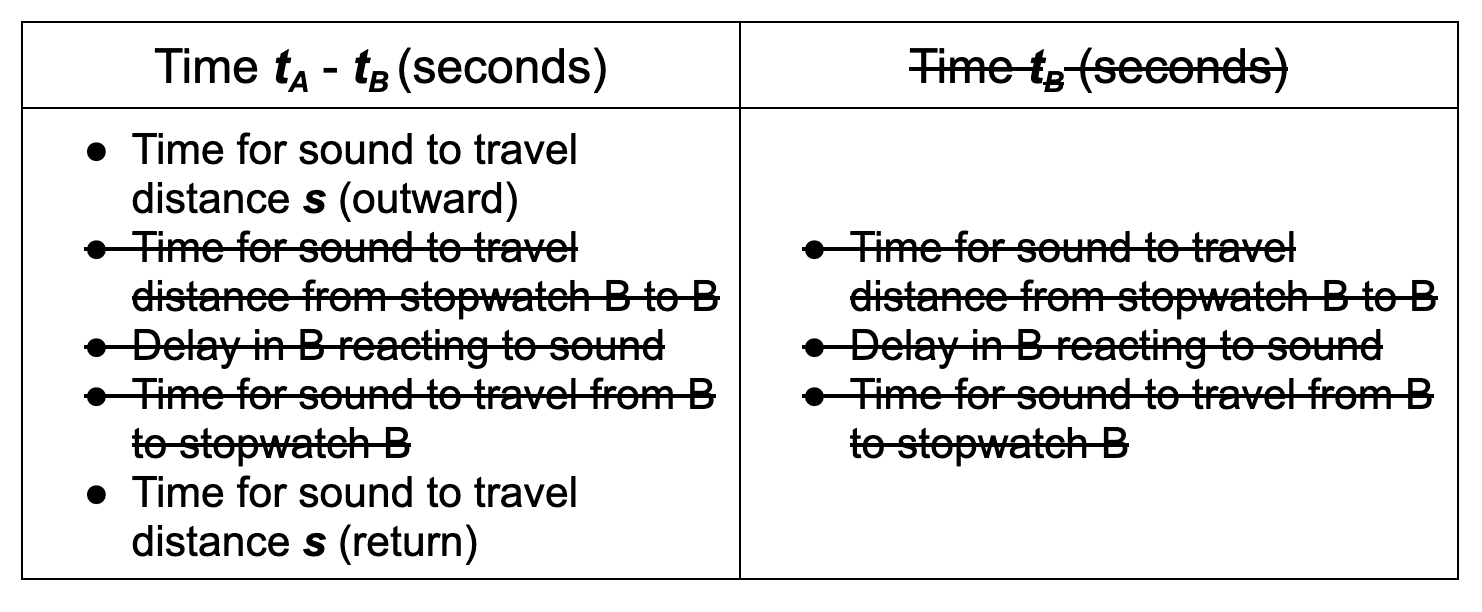
If we subtract tAtB we find that this is the time it takes sound to travel a distance of 2s.

Step 9: We can therefore use this formula to find the v the speed of sound.

We have found that this method works well giving mean values of about 350 m/s for the speed of sound (which will vary with air temperature). This video models the method.

And so we have a reasonably practicable method of measuring the speed of that doesn’t involve complex equipment that is unfamiliar to most students; or a method that involves finding a large and featureless wall that produces a detectable echo when a loud sound is made from a point several metres in front of it.

I don’t know about you, but as a physics teacher, I feel cheated. If it doesn’t involve a double beam oscilloscope, a signal generator, two microphones and two power amplifiers then I simply don’t want to know about it . . .

The Rite of AshkEnte, quite simply, summons and binds Death.  Students of the occult will be aware that it can be performed with a simple incantation, three small bits of wood and 4cc of mouse blood, but no wizard worth his pointy hat would dream of doing anything so unimpressive; they knew in their hearts that if a spell didn’t involve big yellow candles, lots of rare incense, circles drawn on the floor with eight different colours of chalk and a few cauldrons around the place then it simply wasn’t worth contemplating.

Terry Pratchett, ‘Mort’ (1987)

Teaching refraction using a ripple tank

It is a truth universally acknowledged that student misconceptions about waves are legion. Why do so many students find understanding waves so difficult?

David Hammer (2000: S55) suggests that it may, in fact, be not so much a depressingly long list of ‘wrong’ ideas about waves that need to be laboriously expunged; but rather the root of students misconceptions about waves might be a simple case of miscategorisation.

Hammer (building on the work of di Sessa, Wittmann and others) suggests that students are predisposed to place waves in the category of object rather than the more productive category of event.

Thinking of a wave as an object imbues them with a notional permanence in terms of shape and location, as well as an intuitive sense of ‘weightiness’ or ‘mass’ that is permanently associated with the wave.

Looking at a wave through this p-prim or cognitive filter, students may assume that it can be understood in ways that are broadly similar to how an object is understood: one can simply look at or manipulate the ‘object’ whilst ignoring its current environment and without due consideration of its past or its future

For example, students who think that (say) flicking a slinky spring harder will produce a wave with a faster wave speed rather than the wave speed being dependent on the tension in the spring. They are using the misleading analogy of how an object such as a ball behaves when thrown harder rather than thinking correctly about the actual physics of waves.

A series of undulating events…

Hammer suggests that perhaps a more productive cognitive resource that we should seek to activate in our students when learning about waves is that of an event.

An event can be expected to have a location, a duration, a time of occurrence and a cause. Events do not necessarily possess the aspects of permanence that we typically associate with objects; that is to say, an event is expected to be a transient phenomenon that we can learn about by looking, yes, but we have to be looking at exactly the right place at the right time. We also cannot consider them independently of their environment: events have an effect on their immediate environment and are also affected by the environment.

If students think of waves as a series of events propagating through space they are less likely to imbue them with ‘permanent’ properties such as a fixed shape that can be examined at leisure rather than having to be ‘captured’ at one instant. Hammer suggests using a row of falling dominoes to introduce this idea, but you might also care to use this suggested procedure.

You can access an editable copy of the slides that follow in Google Jamboard format by clicking on this link.

Teaching Refraction Step 1: Breaking = bad waves

I like to start by anchoring the idea of changing wave speed in a context that students may be familiar with: waves on a beach. However, we should try and separate the general idea of an undulating water wave from that of a breaking wave. Begin by asking this question:

Give thirty seconds thinking time and then ask students to hold up either one or two fingers on 3-2-1-now! to show their preferred answer. (‘Finger voting’ is a great method for ensuring that every student answers without having to dig out those mini whiteboards).

The correct answer is, of course, the top diagram. This is because the bottom diagram shows a breaking wave.

Teaching Refraction Step 2: Why do waves ‘break’?

In short, because waves slow down as they hit the beach. The top part of the wave is moving faster than the bottom so the wave breaks up as it slides off the bottom part. In effect, the wave topples over because the bottom is moving more slowly than the top part.

The correct answer is ‘two fingers’

It is important that students appreciate that although the wavelength of the wave does change, the frequency of the wave does not. The frequency of the wave depends on the weather patterns that produced the wave in the deep ocean many hundreds or thousand of miles away. The slope of the beach cannot produce more or fewer waves per second. In other words, the frequency of a wave depends on its history, not its current environment.

All the beach can do is change the wave speed, not the wave frequency.

Teaching Refraction Step 3: the view from above

We can check our students’ understanding by asking them to comment or annotate a diagram similar to the one below.

Some good questions to ask — before the wavelength annotations are added — are:

  • Are we viewing the waves from above or from the side? (From above.)
  • Can we tell where the crests of the waves are? (Yes, where the line of foam are.)
  • Can we tell where the troughs of the waves are? (Yes, midway between the crests.)
  • Can we measure the wavelength of the waves? (Yes, the crest to crest distance.)
  • Can we tell if the waves are speeding up or slowing down as they reach the shore? (Yes, the waves are bunching together which suggests that slow down as they reach the shore.)

Teaching Refraction Step 4: Understanding the ripple tank

Physics teachers often assume that the operation and principles of a ripple tank are self-evident to students. In my experience, they are not and it is worth spending a little time exploring and explaining how a ripple tank works.

Teaching Refraction Step 5: the view from the side

Teaching Refraction Step 6: Seeing refraction in the ripple tank (1)

It’s a good idea to first show what happens when the waves hit the boundary at right angles; in other words, when the direction of travel of the waves is parallel to the normal line.

I like to add the annotations live with the class using Google Jamboard. (The questions can be covered with a blank box until you are ready to show them to the students.)

You can access an animated, annotable version of this and the other slides in this post in Google Jamboard format by clicking on this link.

Teaching Refraction Step 7: Seeing refraction in the ripple tank (2)

The next step is to show what happens when the water waves arrive at the boundary at an angle i; in other words, the direction of travel of the waves makes an angle of i degrees with the normal line.

Again, I like to add the annotations live using Google Jamboard.


References

Hammer, D. (2000). Student resources for learning introductory physicsAmerican Journal of Physics68(S1), S52-S59.

Wittmann, M. C., Steinberg, R. N., & Redish, E. F. (1999). Making sense of how students make sense of mechanical wavesThe physics teacher37(1), 15-21.

Waves: Introduce With Trolleys, Not Slinkys

A number of interesting questions came up in the recent author Q&A run by @Chatphysics about my contribution to Cracking Key Concepts in Secondary Science: many thanks to Jinny Bell (@MissB0107) for hosting!

In this post, the question I want to address in more detail is: why do I recommend introducing waves using dynamics trolleys rather than a slinky spring or elastic rope?

I think I have a couple of persuasive reasons; but first a digression.

A thing doing a thing…

Robert Graves wrote his charming comedic poem Welsh Incident in 1929. It describes (at least as I read it) the visitation of disparate group of space aliens to a small town on the North Wales coast in the 1920s.

I will paraphrase one line where the Narrator says:

Then one of things did a thing that was finally recognisable as a thing.

The first example of a thing doing a thing…

Now don’t get me wrong: slinky springs and elastic ropes are brilliant examples of mechanical waves and I do use them (a lot!) — I just don’t use them as the first example.

The problem as I see it is that they could lead students to file wave mechanics in an entirely separate and independent category from mechanics.

I want students to see that wave behaviour isn’t distinct from forces and particles but rather is a direct (and fairly straightforward) consequence of a particular arrangement of particles with a specific pattern of forces between them.

Since the first example, is often the ‘loudest’ (metaphorically speaking), it’s not a bad idea to start with longitudinal waves.

I use standard wooden dynamics trolleys. Dowel rods or metal posts can be used to link the trolleys together. The system is more stable if a pair of springs is used at the front and back of each trolley. The springs used are the ones we typically use for the Hooke’s Law experiment.

A compression carrying energy along a line of trolleys linked by springs can be easily modelled:

Modelling energy transfer by compression of a longitudinal wave using a line of dynamics trolleys and springs

So can a rarefaction:

Using a line of dynamics trolley linked together with spring to demonstrate the transmission of a rarefaction pulse

Transverse waves can be modelled like this:

A transverse wave modelled using a line of dynamics trolleys linked with springs

Amongst the advantages of this approach are:

  • Students are introduced to an unknown thing (wave behaviour) by means of more familiar things (trolleys and springs)
  • The idea that there is no net movement of the ‘particles’ as energy is transferred is much more directly observable using this arrangement rather than the slinky or elastic rope.
  • The frequency of a wave (which in some ways is a more fundamental measurement than wavelength) can be associated with the repeating motion of a single ‘particle’ and extended outwards to the whole system, rather than vice versa.

You can read more in Chapter 25 of Cracking Key Concepts in Secondary Science.

Conclusion

I hope readers will try this demonstation: hopefully introducing students to a thing which is already recognisable as a thing will make wave behaviour more comprehensible and less like an unwelcome diversion into terra incognita.

Readers who are ‘rich in years’ like myself will recognise this demonstration as being adapted from the old Nuffield linear A-level Physics course.

You can listen to Richard Burton’s great reading of Robert Graves’ Welsh Incident here.