Showing complex energy transfers using bar models

Real life energy transfers can be messy. That is to say, they are complicated and difficult to understand. I think many students get lost in the dense forest of verbiage that has to be deployed to describe their detail and nuance. Bar models are, I think, an effective teaching tool to avoid cognitive overload, especially for GCSE Physics and Combined Science students.

Windmills of our minds

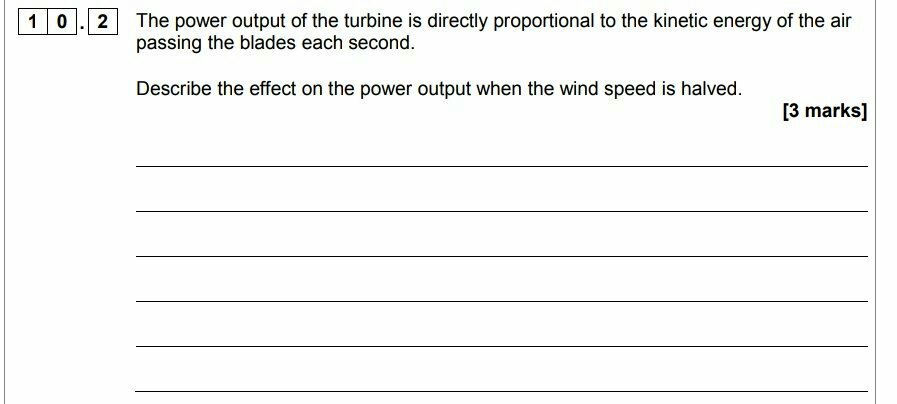
As an example, let’s consider a wind turbine used to generate electricity. As a starting point, let’s think about how much of the kinetic energy ‘harvested’ by the blades is transferred to the generator. The answer is, of course. not as much as we would hope. The majority is, hopefully, but a significant proportion is unavoidably lost via work done by friction to the thermal energy store of the gears.

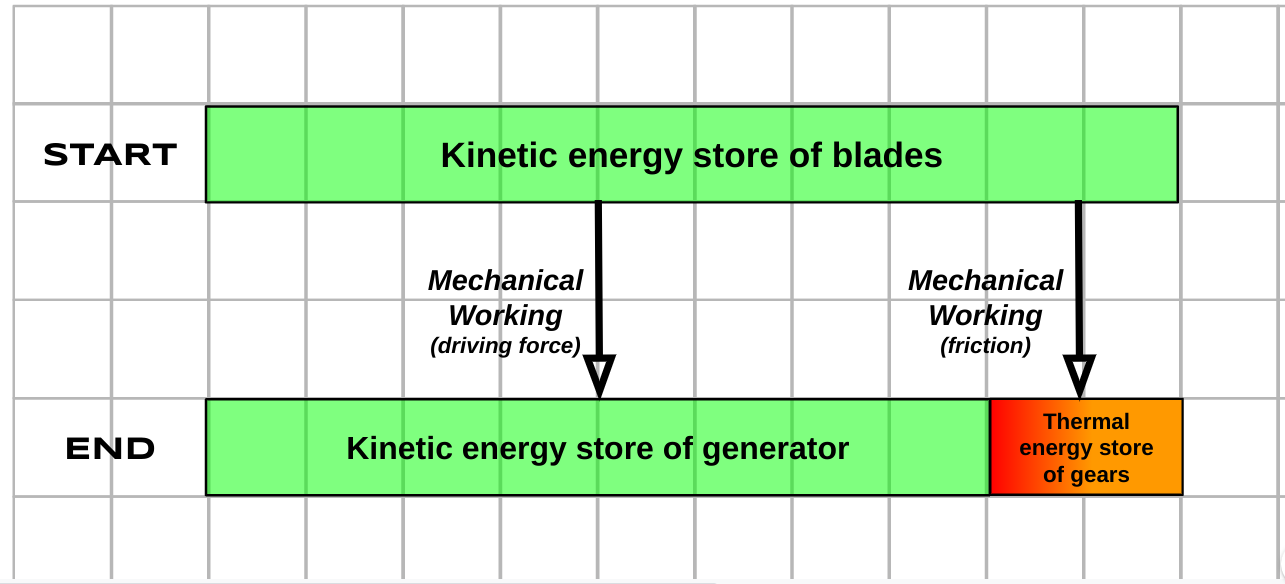
This can be shown in a visually impactful way using the Bar Model approach:

Note that in this style of energy transfer diagram, the Principle of Conservation of Energy is communicated visually via the width of the bars. The bottom ‘End’ bar has to be exactly the same width as the top ‘Start’ bar.

What happens if a helpful maintenance engineer tops up the oil reservoir of the wind turbine? Well, we have a much happier situation, as shown below.

As we can see, a much greater proportion of the total energy is transferred usefully (and can be used to generate electrical power) in a well-maintained wind turbine.

Using energy efficient appliances in the home

How can we explain the advantages of using more efficient appliances in the home?

A diagram like this can help. The household that uses less efficient appliances has to buy more energy from their energy supplier to achieve exactly the same outcomes as the first. This is both more costly for the household as well as demanding that more resources are needed to generate electricity for no good reason.

Parachute vs. no parachute

Exactly the same amount of energy is transferred from the gravitational energy store of a parachutist whether their parachute deploys successfully or not. However, in the case of a successful deployment, much more energy is transferred into the thermal energy store of the surroundings than into their kinetic energy store. This helps ensure a safe landing!

Units, you nit!

The S.I. System of Units is a thing of beauty: a lean, sinewy and utilitarian beauty that is the work of many committees, true; but in spite of that common saw about ‘a camel being a horse designed by a committee’, the S.I. System is truly a thing of rigorous beauty nonetheless.

Even the pedestrian Wikipedia entry on the 2019 Redefinition of the S.I. System reads like a lost episode from Homer’s Odyssey. As Odysseus tied himself to the mast of his ship to avoid the irresistible lure of the Sirens, so in 2019 the S.I, System tied itself to the values of a select number of universal physical constants to remove the last vestiges of merely human artifacts such as the now obsolete International Prototype Kilogram.

Meet the new (2019) SI, NOT the same as the old SI

However, the austere beauty of the S.I. System is not always recognised by our students at GCSE or A-level. ‘Units, you nit!!!’ is a comment that physics teachers have scrawled on student work from time immemorial with varying degrees of disbelief, rage or despair at errors of omission (e.g. not including the unit with a final answer); errors of imprecision (e.g. writing ‘j’ instead of ‘J’ for ‘joule — unforgivable!); or errors of commission (e.g. changing kilograms into grams when the kilogram is the base unit, not the gram — barbarous!).

The saddest occasion for writing ‘Units, you nit!’ at least in my opinion, is when a student has incorrectly converted a prefix: for example, changing millijoules into joules by multiplying by one thousand rather than dividing by one thousand so that a student writes that 5.6 mJ = 5600 J.

This odd little issue can affect students from across the attainment range, so I have developed a procedure to deal with it which is loosely based on the Singapore Bar Model.

A procedure for illustrating S.I. unit conversions

One millijoule is a teeny tiny amount of energy, so when we convert it joules it is only a small portion of one whole joule. So to convert mJ to J we divide by 1000.

One joule is a much larger quantity of energy than one millijoule, so when we convert joules to millijoules we multiply by one thousand because we need one thousand millijoules for each single joule.

In time, and if needed, you can move to a simplified version to remind students.

A simplified procedure for converting units

Strangely, one of the unit conversions that some students find most difficult in the context of calculations is time: for example, hours into seconds. A diagram similar to the one below can help students over this ‘hump’.

Helping students with time conversions

These diagrams may seem trivial, but we must beware of ‘the Curse of Knowledge’: just because we find these conversions easy (and, to be fair, so do many students) that does not mean that all students find them so.

The conversions that students may be asked to do from memory are listed below (in the context of amperes).

A table showing all the SI prefixes that GCSE students need to know

Why does kinetic energy = 1/2mv^2?

Why does kinetic energy Ek=½mv2?

Students and non-specialist teachers alike wonder: whence the half?

This post is intended to be a diagrammatic answer to this question using a Singapore Bar Model approach: so pedants, please avert your eyes.

I am indebted to Ben Rogers’ recent excellent post on showing momentum using the Bar Model approach for starting me thinking along these lines.

Part the First: How to get the *wrong* answer

Imagine pushing an object with a mass m with a constant force F so that it accelerates with a constant acceleration a so that covers a distance s in a time t. The object was initially at rest and ends up moving at velocity v.

Screenshot 2019-03-09 at 14.24.59.png

(On the diagram, I’ve used the SUVAT dual coding conventions that I suggested in a previous post.)

So let’s consider the work done on the object by the force:

Step 1: work done = force x distance moved in the direction of the force

Step 2: Wd = F x s

But remember s = v x t so:

Step 3: Wd = F x vt

And also remember that F = m x a so:

Step 4: Wd = ma x vt

Also remember that a = change in velocity / time, so a = (v – 0) / t = v / t.

Step 5: Wd = m (v / t) x vt

The ts cancel so:

Step 6: Wd = mv2

Since this is the work done on the object by the force, it is equal to the energy transferred to the kinetic energy store of the object. In other words, it is the energy the object has gained because it is moving — its kinetic energy, no less: Ek = mv2.

On a Singapore Bar Model diagram this can be represented as follows:

Screenshot 2019-03-09 at 15.14.17

The kinetic energy is represented by the volume of the bar.

But wait: Ek=mv2!?!?

That’s just wrong: where did the half go?

Houston, we have a problem.

Part the Second: how to get the *right* answer

The problem lies with Step 3 above. We wrongly assumed that the object has a constant velocity over the whole of the distance s.

Screenshot 2019-03-09 at 17.35.43.png

It doesn’t because it is accelerating: it starts off moving slowly and ends up moving at the maximum, final velocity v when it has travelled the total distance s.

So Step 3 should read:

But remember that s = (average velocity) x t.

Because the object is accelerating at a constant rate, the average velocity is (v + u) / 2 and since u = 0 then average velocity is v / 2.

Step 3: Wd= F x (v / 2) t

And also remember that F = m x a so:

Step 4: Wd= ma x (v / 2) t

Also remember that a = change in velocity / time, so a = (v – 0) / t = v / t.

Step 5: Wd = m (v / t) x (v / 2) t

The ts cancel so:

Step 6: Wd= ½mv2

Based on this, of course, Ek = ½mv2
(Phew! Houston, we no longer have a problem.)

Screenshot 2019-03-09 at 17.58.45.png

Using the Bar Model representation, the volume of the bar which is above the blue plane represents the kinetic energy of an object of mass m moving at a velocity v.

Another way of representing the kinetic energy as a solid prism is shown below.

The reason it is half the volume of the bar and not the full volume (as in the incorrect Part the First analysis) is because we are considering the work done by a constant force accelerating an object which is initially at rest; the velocity of the object increases gradually from zero as the force acts upon it. It therefore takes a longer time to cover the distance s than if it was moving at a constant velocity v from the very beginning.

So there we have it, Ek = ½mv2 by a rather circuitous method.

But why go “all around the houses” in this manner? For exactly the same reason as we might choose to go by the path less travelled on some of our other journeys: quite simply, we might find that we enjoy the view.

Kinetic Energy Using The Singapore Bar Model

I think the Singapore Bar Model is a neat bit of pedagogy that has great potential in Science education.

Essentially, the Singapore Bar Model uses pictorial representations (often in the form of a bar or line) to help students bridge the gap between concrete and abstract reasoning. I wrote about one possible application here.

A recent discussion on Twitter started me thinking about if it could be applied to kinetic energy.

For example, how would you explain what happens to the kinetic energy of an object if its velocity is halved?

Many students assume that the KE would halve as well, instead of reducing to a quarter of its original value.

How can we help students grasp this slippery concept without using algebra? Algebra would work fine with your higher sets, of course, but not necessarily for other groups.

This gives a clear visual representation of the fact that the KE quarters when the velocity halves. In other words, 0.5 x 0.5 = 0.25.

(Note that I have purposefully used decimals as we know that many students struggle with fractions(!))

Many students found the following question on an AQA paper extremely challenging:

The correct answer is that the power output drops to one eighth of its original value.

Could the Singapore Bar Model helps students to see why this is the case?

I think it could: