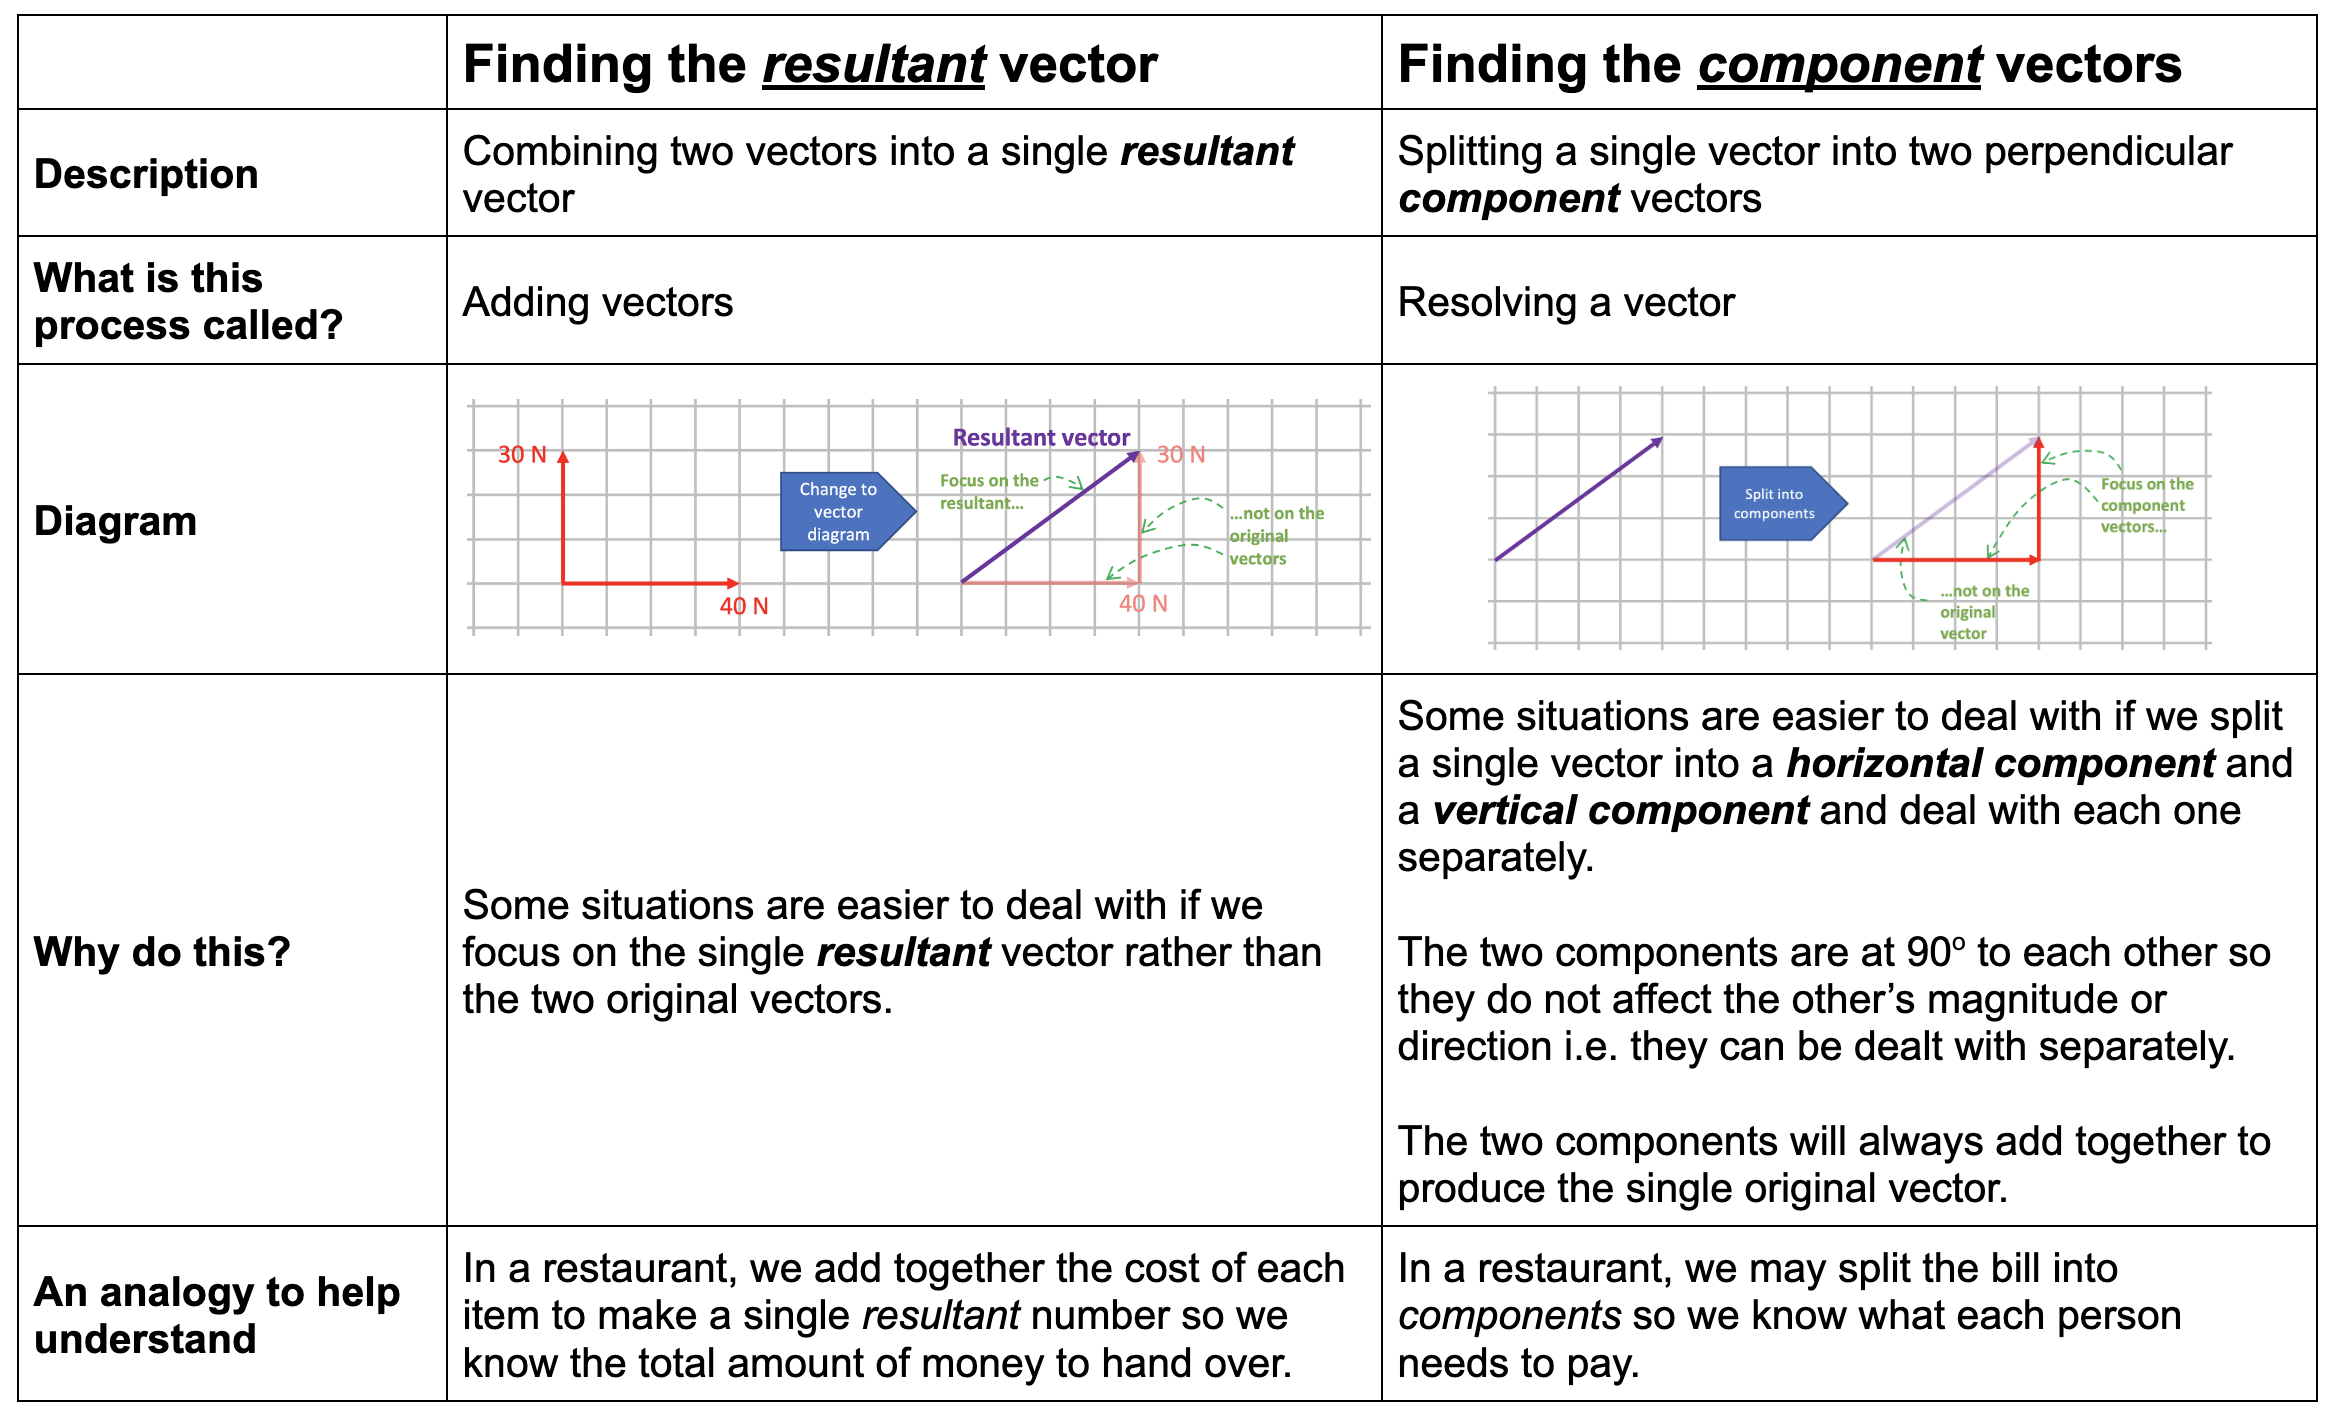
This post suggests some strategies for teaching vectors to 14-16 olds. In part 1 we looked at the idea of combining two vectors into one; that is to say, finding the resultant vector. In this part, we’re going to look at the inverse operation: splitting a single vector into two component vectors.
We’re going to use scale drawing rather than trigonometry since (a) this often leads to a more secure understanding; and (b) it is the expected method in the UK curriculum for 14-16 year olds.
What is a component vector?
A component vector is one of at least two vectors that will combine to give one single original vector. The component vectors are chosen so that they are mutually perpendicular. Because of this, they cannot affect each other’s magnitude and direction and so can be dealt with separately and independently; that is to say, we can choose to consider what effect the vertical component will have on its own without having to worry about what effect the horizontal component will have.
Introducing components as ‘the vector less travelled by’
Two roads diverged in a wood, and I—
I took the one less traveled by,
And that has made all the difference.

Robert Frost, 'The Road Less Travelled'
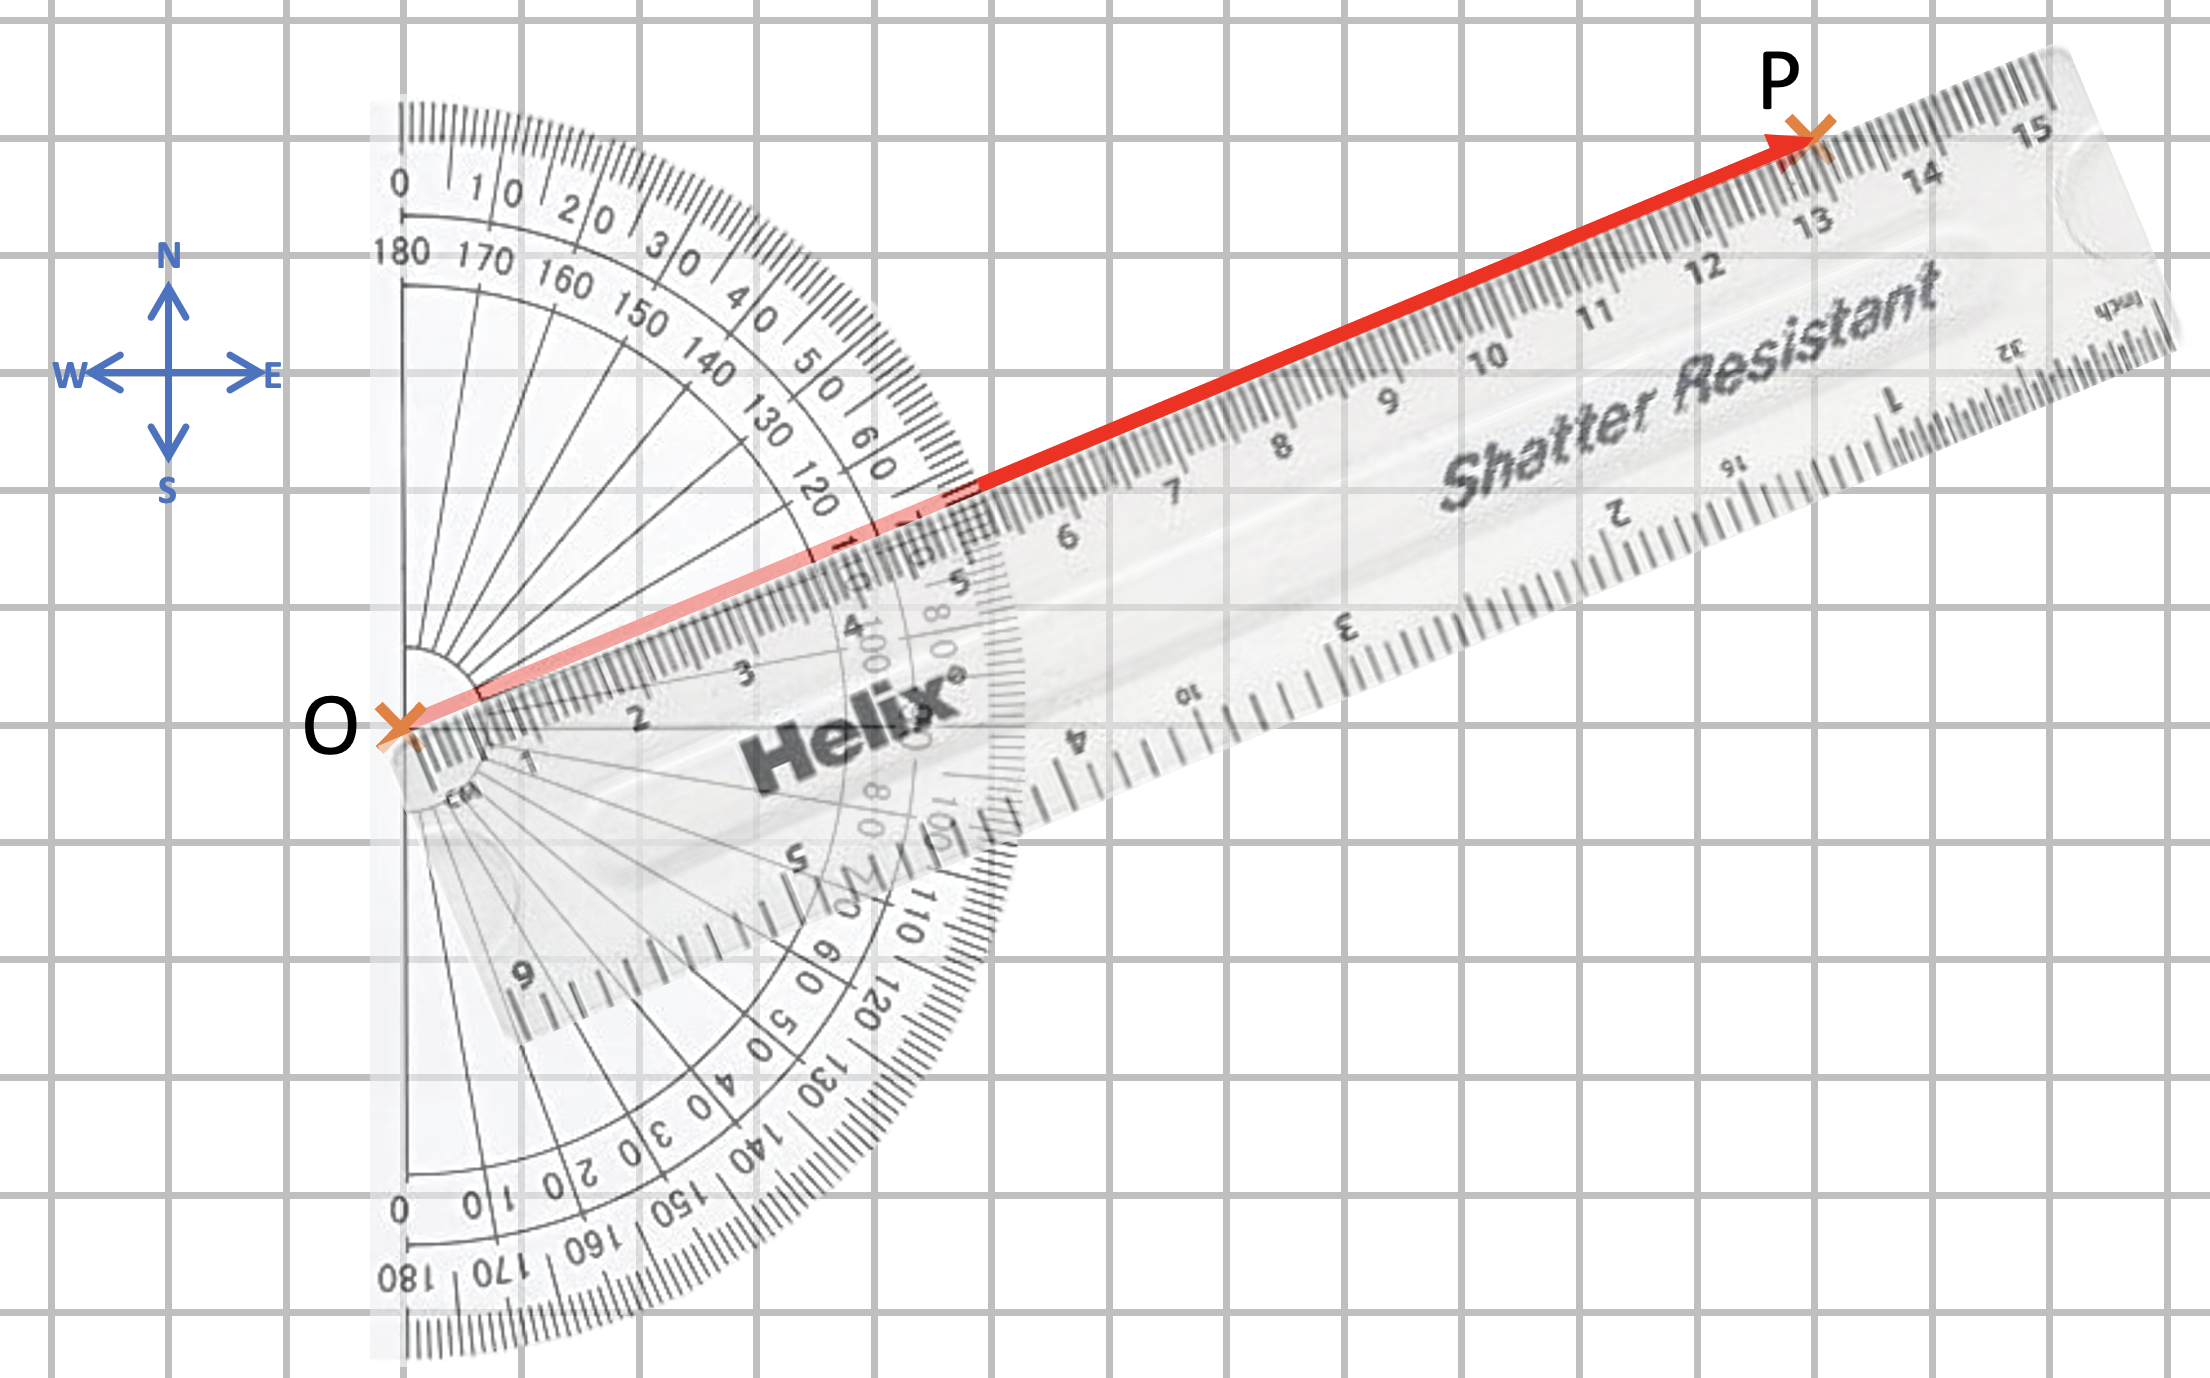
Let’s say we travelled a distance of 13 m from point O to point P on a compass bearing of 067 degrees (bear with me, I’m working with a slightly less familiar Pythagorean 3:4:5 triple here). This could be drawn as a scale diagram as shown below.
Could we analyse the displacement OP in terms of an eastward displacement and a northward displacement?
We can — as shown below.
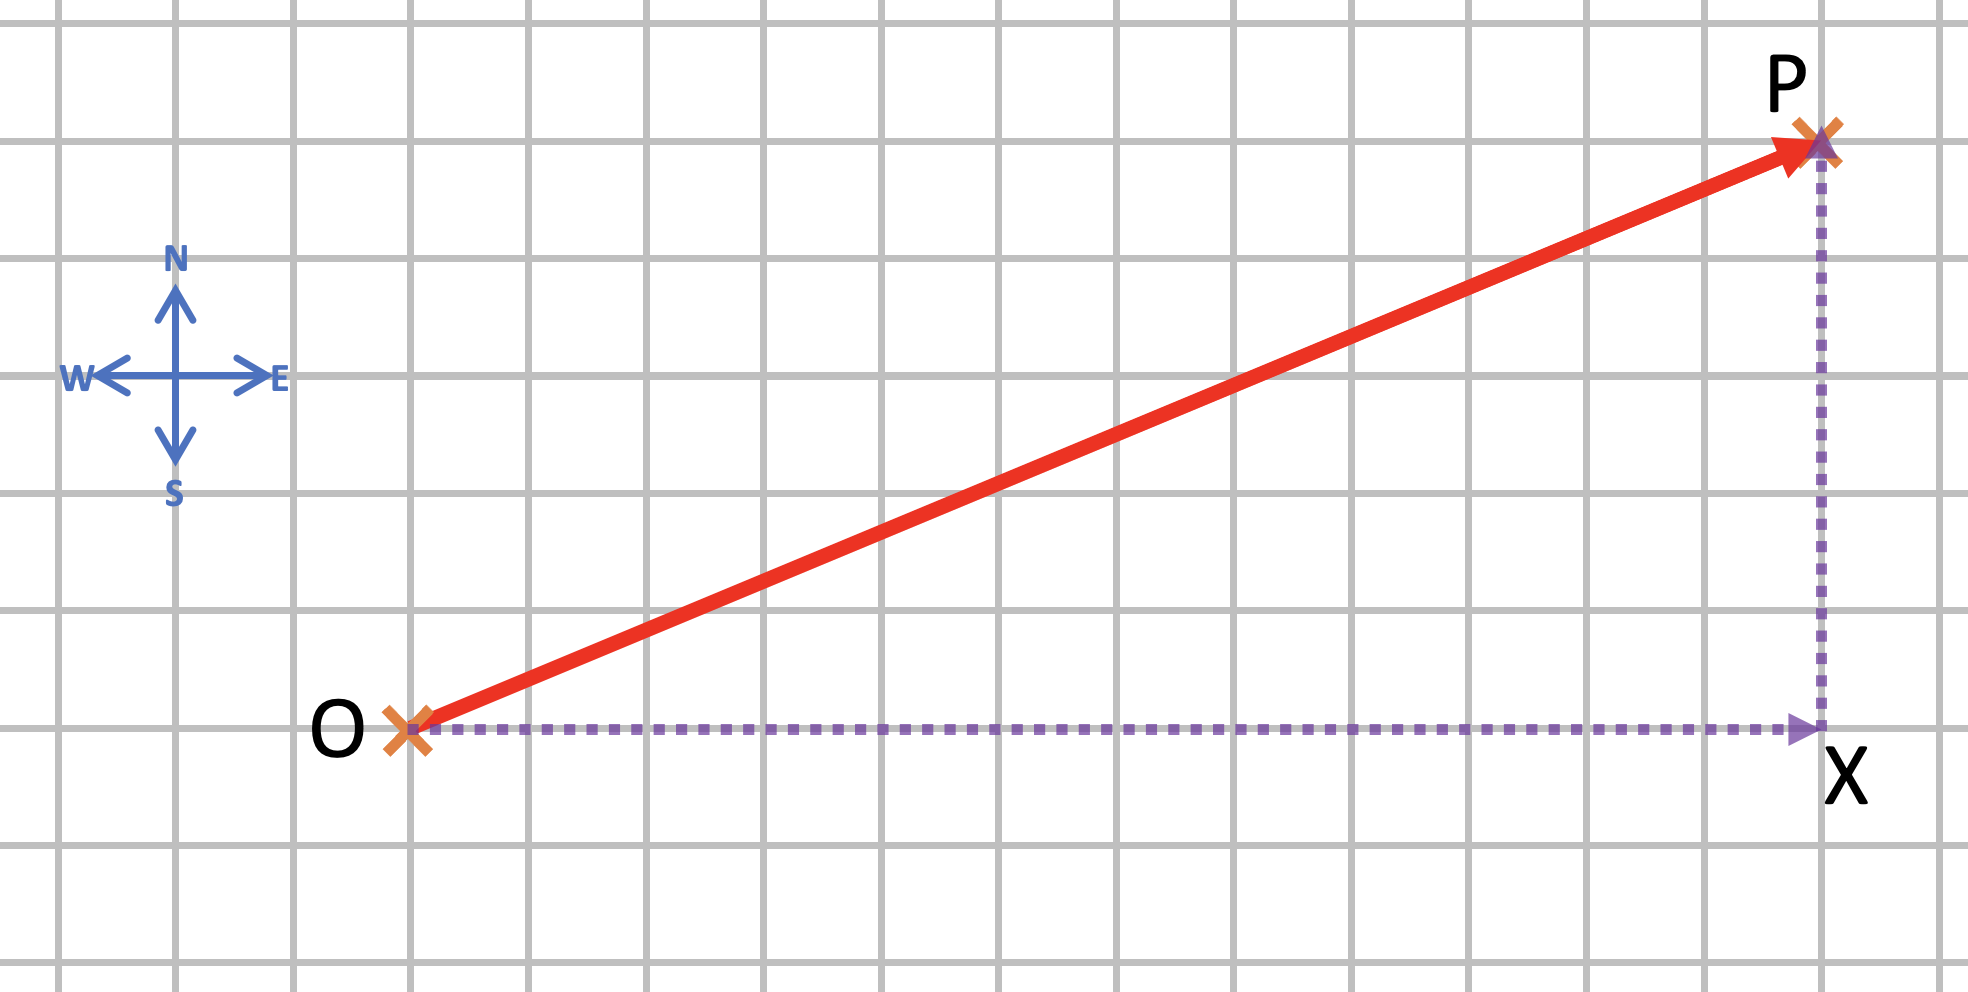
The dotted line OX is the eastward (horizontal on our diagram) component of the displacement OP. It is drawn as a dotted line because it is (literally) the ‘road less travelled’. We did not walk along that road — and that’s why it is drawn as a dotted line — but we could have done.
But let’s say that we had, and that we had stopped when we reached the point marked X. And then we look around, and strike out northwards and walk the (vertical) ‘road less travelled called XP — and we end up at P.
So walking one road less travelled might, indeed, make ‘all the difference’ — but walking two roads less travelled does not.
To rewrite Robert Frost: We took the two roads less travelled by / And that has made NO difference.
But why should we wish to go the ‘long way around’, even if we still end up at P? Because it would allow us to work out the change in longitude and latitude. By moving from O to P we change our longitude by 12 metres and our latitude by 5 metres. (Don’t believe me? Count the squares on the diagram!)
We have resolved the 13 metre distance into two components: one eastward (horizontal) component of 12 metres and one northward component of 5 metres.
Using resolving a vector into components to solve problems
. . . setting storms and billows at defiance, and visiting the remotest parts of the terraqueous globe.
Samuel Johnson, The Rambler, 17 April 1750
That an object in free fall will accelerate towards the centre of our terraqueous globe at a rate of 9.81 metres per second per second is, at best, only a partial and parochial truth. It is 9.81 metres per second per second in the United Kingdom, yes; but the value of both acceleration due to free fall and the gravitational field strength vary from place to place across the globe (and in the SI System of measurement, the two quantities are numerically equal and dimensionally equivalent).
For example, according to Hirt et al. (2013) the lowest value for g on the Earth’s surface is atop Mount Huascarán in Peru where g = 9.7639 m s-2 and the highest is at the surface of the Arctic Ocean where g = 9.8337 m s-2.
Why does g vary?
There are three factors which can affect the local value of g.
Firstly, the distribution of mass within the volume of the Earth. The Earth is not of uniform density and volumes of rock within the crust of especially high or low density could affect g at the surface. The density of the rocks comprising the Earth’s crust varies between 2.6 – 2.9 g/cm3 (according to Jones 2007). This is a variation of 10% but the crust only comprises about 1.6% of the Earth’s mass since the density of material in the mantle and core is far higher so the variation in g due this factor is probably of the order of 0.2%.
Secondly, the Earth is not a perfect sphere but rather an oblate spheroid that bulges at the equator so that the equatorial radius is 6378 km but the polar radius is 6357 km. This is a variation of 0.33% but since the gravitational force is proportional to 1/r2 let’s assume that this accounts for a possible variation of the order of 0.7% in the value of g.
Thirdly, the acceleration due to the rotation of the Earth. We will look in detail at the theory underlying this in a moment, but from our rough and ready calculations above, it would seem that this is the major factor accounting for any variation in g: that is to say, g is a minimum at the equator and a maximum at the poles because of the Earth’s rotation.
The Gnome Experiment
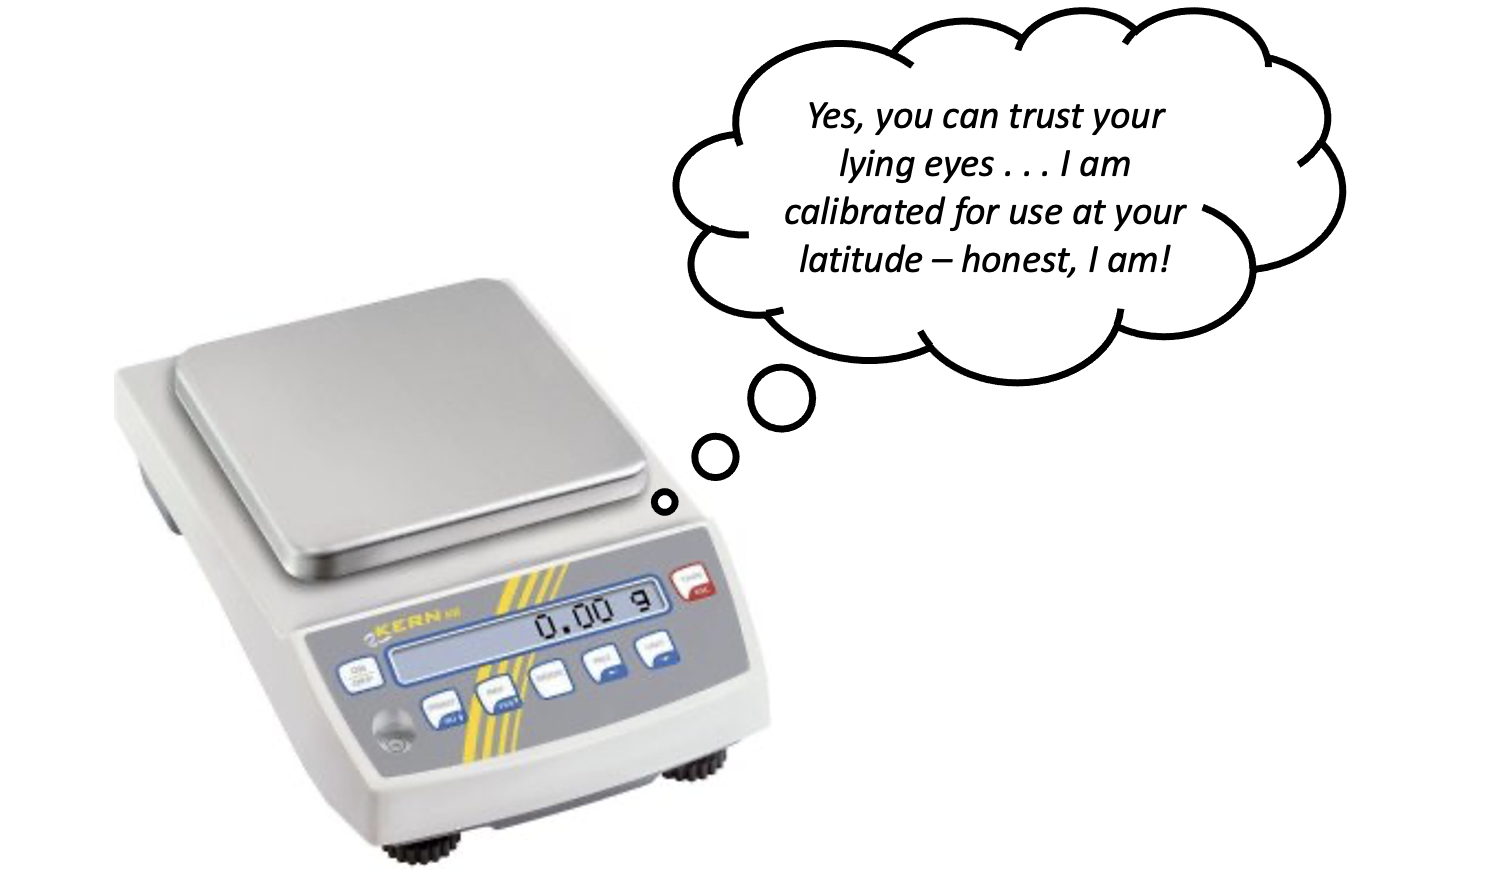
In 2012, precision scale manufacturers Kern and Sohn used this well-known variation in the value of g to embark on a highly successful advertising campaign they called the ‘Gnome Experiment’ (see link 1 and link 2).
Whatever units their lying LCD displays show, electronic scales don’t measure mass or even weight: they actually measure the reaction force the scales exert on the item in their top pan. The reading will be affected if the scales are accelerating.
In diagram A, the apple is not accelerating so the resultant upward force on the apple is exactly 0.981 N. The scales show a reading of 0.981/9.81 = 0.100 000 kg = 100.000 g (assuming, of course, that they are calibrated for use in the UK).
In diagram B, the apple and scales are in an elevator that is accelerating upward at 1.00 metres per second per second. The resultant upward force must therefore be larger than the downward weight as shown in the free body diagram. The scales show a reading of 1.081/9.81 – 0.110 194 kg = 110.194 g.
In diagram C, the the apple and scales are in an elevator that is accelerating downwards at 1.00 metres per second per second. The resultant upward force must therefore be smaller than the downward weight as shown in the free body diagram. The scales show a reading of 0.881/9.81 – 0.089 806 kg = 89.806 g.
Never mind the weight, feel the acceleration
Now let’s look at the situation the Kern gnome mentioned above. The gnome was measured to have a ‘mass’ (or ‘reaction force’ calibrated in grams, really) of 309.82 g at the South Pole.
Showing this situation on a diagram:
Looking at the free body diagram for Kern the Gnome at the equator, we see that his reaction force must be less than his weight in order to produce the required centripetal acceleration towards the centre of the Earth. Assuming the scales are calibrated for the UK this would predict a reading on the scales of 3.029/9.81= 0.30875 kg = 308.75 g.
The actual value recorded at the equator during the Gnome Experiment was 307.86 g, a discrepancy of 0.3% which would suggest a contribution from one or both of the first two factors affecting g as discussed at the beginning of this post.
Although the work of Hirt et al. (2013) may seem the definitive scientific word on the gravitational environment close to the Earth’s surface, there is great value in taking measurements that are perhaps more directly understandable to check our comprehension: and that I think explains the emotional resonance that many felt in response to the Kern Gnome Experiment. There is a role for the ‘artificer’ as well as the ‘philosopher’ in the scientific enterprise on which humanity has embarked, but perhaps Samuel Johnson put it more eloquently:
The philosopher may very justly be delighted with the extent of his views, the artificer with the readiness of his hands; but let the one remember, that, without mechanical performances, refined speculation is an empty dream, and the other, that, without theoretical reasoning, dexterity is little more than a brute instinct.
Newton’s First and Second Laws of Motion are universal: they tell us how any set of forces will affect any object.
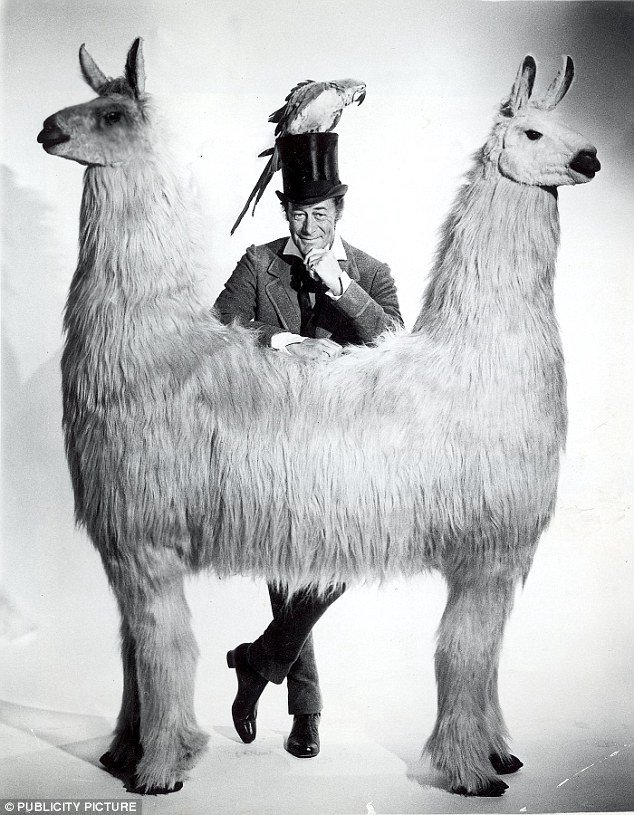
The “Push-Me-Pull-You” made famous by Dr Doolittle
If the forces are ‘balanced’ (dread word! — saying ‘total force is zero’ is better, I think) then the object will not accelerate: that is the essence of the First Law. If the sum of the forces is anything other than zero, then the object will accelerate; and what is more, it will accelerate at a rate that is directly proportional to the total force and inversely proportional to the mass of the object; and let’s not forget that it will also accelerate in the direction in which the total force acts. Acceleration is, after all, a vector quantity.
So far, so good. But what about the Third Law? It goes without saying, I hope, that Newton’s Third Law is also universal, but it tells us something different from the first two.
The first two tell us how forces affect objects; the third tells us how objects affect objects: in other words, how objects interact with each other.
The word ‘interact’ can be defined as ‘to act in such a way so as to affect each other’; in other words, how an action produces a reaction. However, the word ‘reaction’ has some unhelpful baggage. For example, you tap my knee (lightly!) with a hammer and my leg jerks. This is a reaction in the biological sense but not in the Newtonian sense; this type of reaction (although involuntary) requires the involvement of an active nervous system and an active muscle system. Because of this, there is a short but unavoidable time delay between the stimulus and the response.
The same is not true of a Newton Third Law reaction: the action and reaction happen simultaneously with zero time delay. The reaction is also entirely passive as the force is generated by the mere fact of the interaction and requires no active ‘participation’ from the ‘acted upon’ object.
I try to avoid the words ‘action’ and ‘reaction’ in statements of Newton’s Third Law for this reason.
If body A exerts a force on body B, then body B exerts an equal and opposite force on body A.
The best version of Newton’s Third Law(imho)
In our universe, body B simply cannot help but affect body A when body A acts on it. Newton’s Third Law is the first step towards understanding that of necessity we exist in an interconnected universe.
Getting the Third Law wrong…
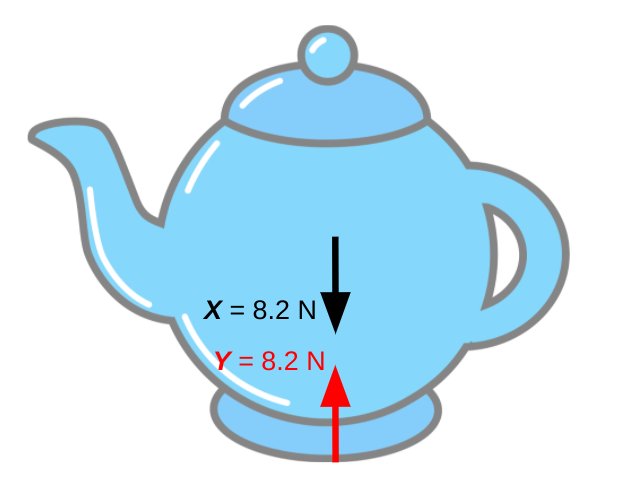
Let’s consider a stationary teapot. (Why not?)
This is NOT a good illustation of Newton’s Third Law…
We can reject this as an appropriate example of Newton’s Third Law for two reasons:
Reason 1: Force X and Force Y are acting on a single object. Newton’s Third Law is about the forces produced by an interaction between objects and so cannot be illustrated by a single object.
Reason 2: Force X and Force Y are ‘equal’ only in the parochial and limited sense of being merely ‘equal in magnitude’ (8.2 N). They are very different types of force: X is an action-at-distance gravitational force and Y is an electromagnetic contact force. (‘Electromagnetic’ because contact forces are produced by electrons in atoms repelling the electrons in other atoms.) The word ‘equal’ in Newton’s Third Law does some seriously heavy lifting…
Getting the Third Law right…
The Third Law deals with the forces produced by interactions and so cannot be shown using a single diagram. Free body diagrams are the answer here (as they are in a vast range of mechanics problems).
This is a good illustration of Newton’s Third Law
The Earth (body A) pulls the teapot (body B) downwards with the force X so the teapot (body B) pulls the Earth (body A) upwards with the equal but opposite force W. They are both gravitational forces and so are both colour-coded black on the diagram because they are a ‘Newton 3 pair’.
It is worth noting that, applying Newton’s Second Law (F=ma), the downward 8.2 N would produce an acceleration of 9.8 metres per second per second on the teapot if it was allowed to fall. However, the upward 8.2 N would produce an acceleration of only 0.0000000000000000000000014 metres per second per second on the rather more massive planet Earth. Remember that the acceleration produced by the resultant force is inversely proportional to the mass of the object being accelerated.
Similarly, the Earth’s surface pushes upward on the teapot with the force Y and the teapot pushes downward on the Earth’s surface with the force Z. These two forces form a Newton 3 pair and so are colour-coded red on the diagram.
We can summarise this in the form of a table:
Testing understanding
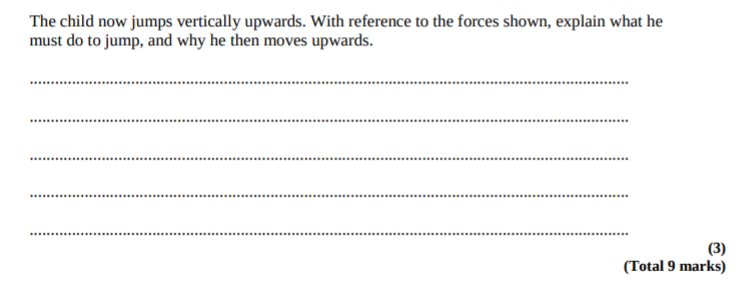
One the best exam questions to test students’ understanding of Newton’s Third Law (at least in my opinion) can be found here. It is a really clever question from the legacy Edexcel specificiation which changed the way I thought about Newton’s Third Law because I was suddenly struck by the thought that the only force that we, as humans, have direct control over is force D on the diagram below. Yes, if D increases then B increases in tandem, but without the weighty presence of the Earth we wouldn’t be able to leap upwards…
There is nothing absurd about perpetual motion; everywhere we look—at the planets wheeling around the Sun, or the electrons circling the heart of the atom—we see examples of it. Where there is no friction, as in airless space, an object can keep moving forever.
Arthur C. Clarke, Things That Can Never Be Done (1972)
So, according to Arthur C. Clarke, famous author and originator of the idea of the geosynchronous communications satellite, perpetual motion is no big deal. What is a big deal, of course, is arranging for such perpetual motion to occur on Earth. This is a near impossibilty, although we can get close: Clarke suggests magnetically suspending a heavy flywheel in a vacuum. (He also goes on to make the point that perpetual motion machines that can do useful external work while they run are, in fact, utterly impossible.)
The lack of visible examples of perpetual motion on Earth is, I think, why getting students to accept Newton’s First Law of Motion is such a perpetual struggle.
Newton’s First Law of Motion
Every body continues in its state of rest or uniform motion in a straight line, except insofar as it doesn’t.
A. S. Eddington, The Nature Of The Physical World (1958)
I think Sir Arthur Eddington was only half-kidding when he mischieviously rewrote the First Law as above. There is a sense where the First Law is superfluous.
It is superfluous because, technically, it is subsumed by the more famous Second Law which can be stated as F=ma where F is the resultant (or total) force acting on an object. Where the acceleration a is zero, as it would be for ‘uniform motion in a straight line’, then the resultant force is zero.
However, the point of the First Law is to act as the foundation stone of Newtonian dynamics: any deviation of an object from a straight line path is taken as implying the existence of a resultant force; if there is no deviation there no force and vice versa.
The First Law is an attempt to reset our Earth-centric intuition that a resultant force is needed to keep things moving, rather than change the perpetual motion of an object. In other words, our everyday, lived experience that to make (say) a box of books move with uniform motion in a straight line we need to keep pushing is wrong…
Newton’s First Law, for real this time
A more modern formulation of Newton’s First Law might read:
An object experiencing zero resultant force will either: (a) remain stationary; or, (b) keep moving a constant velocity.
In my experience, students generally have no difficulty accepting clause (a) as long as they understand what we mean by a ‘zero resultant force’. As in so many things, example is possibly the best teacher:
The meaning of zero and non-zero resultant force
Clause (b) uses the concept of ‘constant velocity’ to avoid the circuitous ‘uniform motion in a straight line’. It is this second clause which gives many students difficulty because they hold the misconception that force is needed to sustain motion rather than change it.
And, truth be told, bearing in mind what students’ lived experience of motion on Earth is, it’s easy to see why they find clause (b) so uncongenial.
Is there any way of making clause (b) more palatable to your typical GCSE student?
Galileo Galilei was one of the giants on whose shoulders Newton stood. His principle of inertia anticipated Newton’s First Law by nearly a century.
What follows is a variation of a ‘thought experiment’ that Galileo advanced in support of the principle of inertia; that is to say, that objects will continue moving at a constant velocity unless they are acted on by a resultant force. (A similar version from the IoP can be found here.)
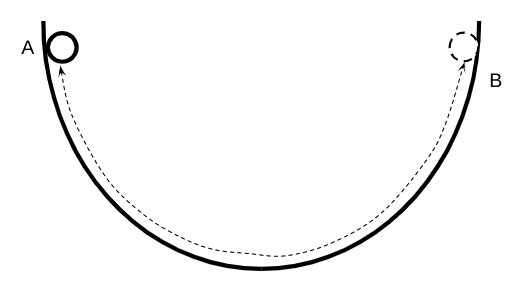
Galileo’s U-shaped Track for the principle of inertia
Picture a ball placed at point A on the track and released.
Galieo’s U-shaped track (1/4): what we see in the real world…
What we see is the ball oscillating back and forth along the track. However, what we also observe is that the height reached by the ball gradually decreases. This is because of resistive forces that slow down the ball (e.g. friction between the track and the ball and air resistance).
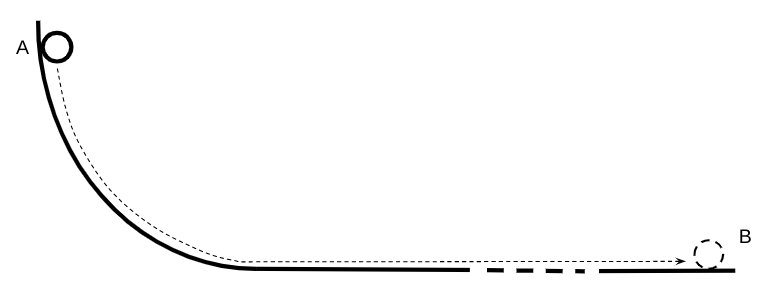
What would happen if we stretched out one side of the curve to make a flat line?
Galieo’s U-shaped track (2/4): an extrapolation from what we see in the real world…
We surmise that the ball would come to a stop at some distant point B because of the same resistive forces we observed above.
Next, we return to the U-shaped track and think about what would happen if we lived in a world without any resistive forces.
Galieo’s U-shaped track (3/4): an extrapolation of what we would see in a world with no resistive forces…
The ball would oscillate back-and-forth between A and B. The height would not decrease as there would be no resistive forces.
Finally, what would happen in our imaginary, perfectly frictionless world if we stretched out one side of the ‘U’?
Galieo’s U-shaped track (4/4): a further extrapolation of what we might see in a world with no resistive force…
The ball would keep moving at a constant velocity because there would be no resistive forces to make it slow down.
This, then, is the way things move when no forces are acting on them: when the (resultant) force is zero, in other words.
Conclusion
Galileo framed the argument above (although he used a V-shaped track rather than a U-shaped one) to persuade a ‘tough crowd’ of Aristotleans of the plausibility of the principle of inertia.
In my experience, it can be a helpful argument to persuade even a ‘tough crowd’ of GCSE students to look at the world anew through a Newtonian lens…
Postscript
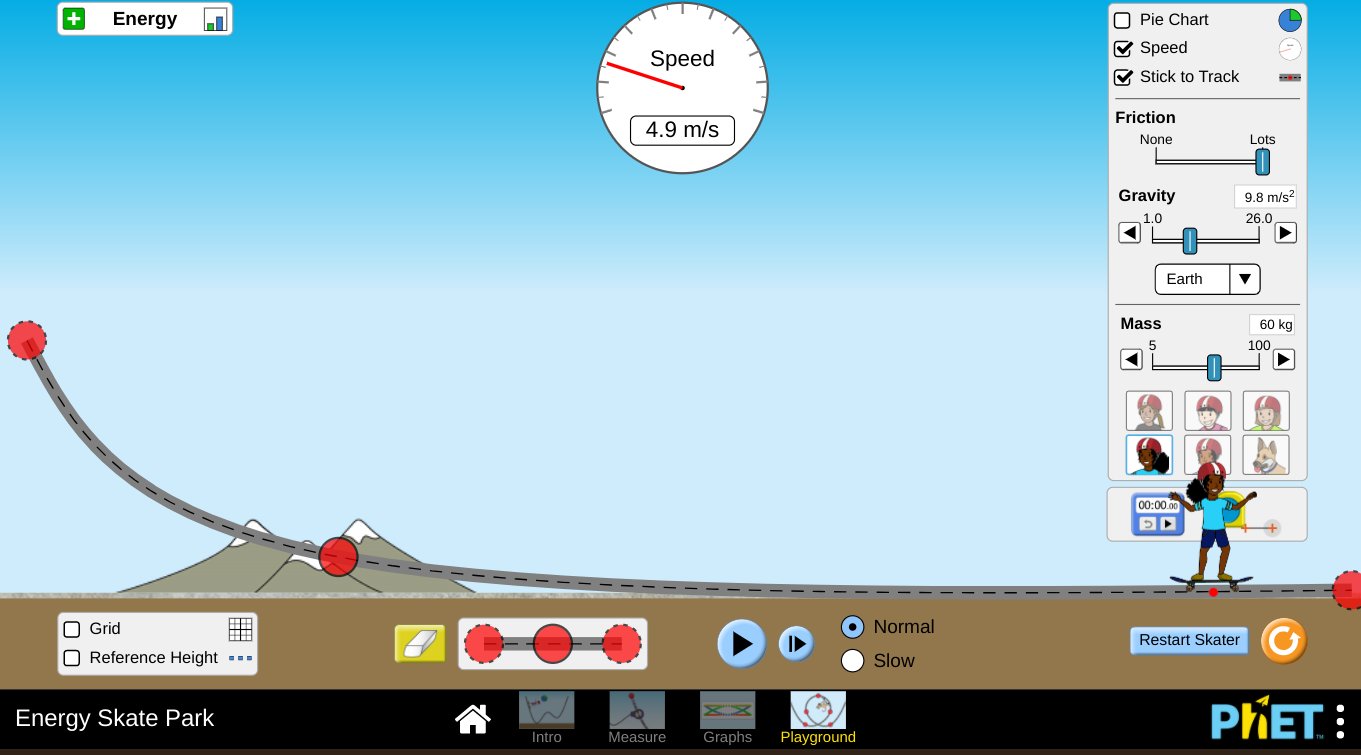
My excellent edu-Twitter colleague Matt Perks (@dodiscimus) points out that you can model Galileo’s U-shaped track using the PhET Energy Skate Park simulation and that you can even set the value of friction to zero and other values.
Click on the link above, select Playground, build a U-shaped track, set the friction slider to a certain value and away you go!
Using the PhET Energy Skate Park to model Galileo’s U-shaped trackYou can even model the decrease in speed because of frictional forces!
This could be a real boon to helping students visualise the thought experiment.
I don’t want to turn the world upside down — I just want to make it a little bit tilty.
In this post, I want to look at the physics of inclined planes, as this is a topic that can trip up students at GCSE and A-level. I believe that one of the reasons for this is that students often have only a fuzzy notion of what we mean by ‘vertical’ and ‘perpendicular’. These terms are often treated as synonymous so I think they could do with some unpicking.
The absolute vertical
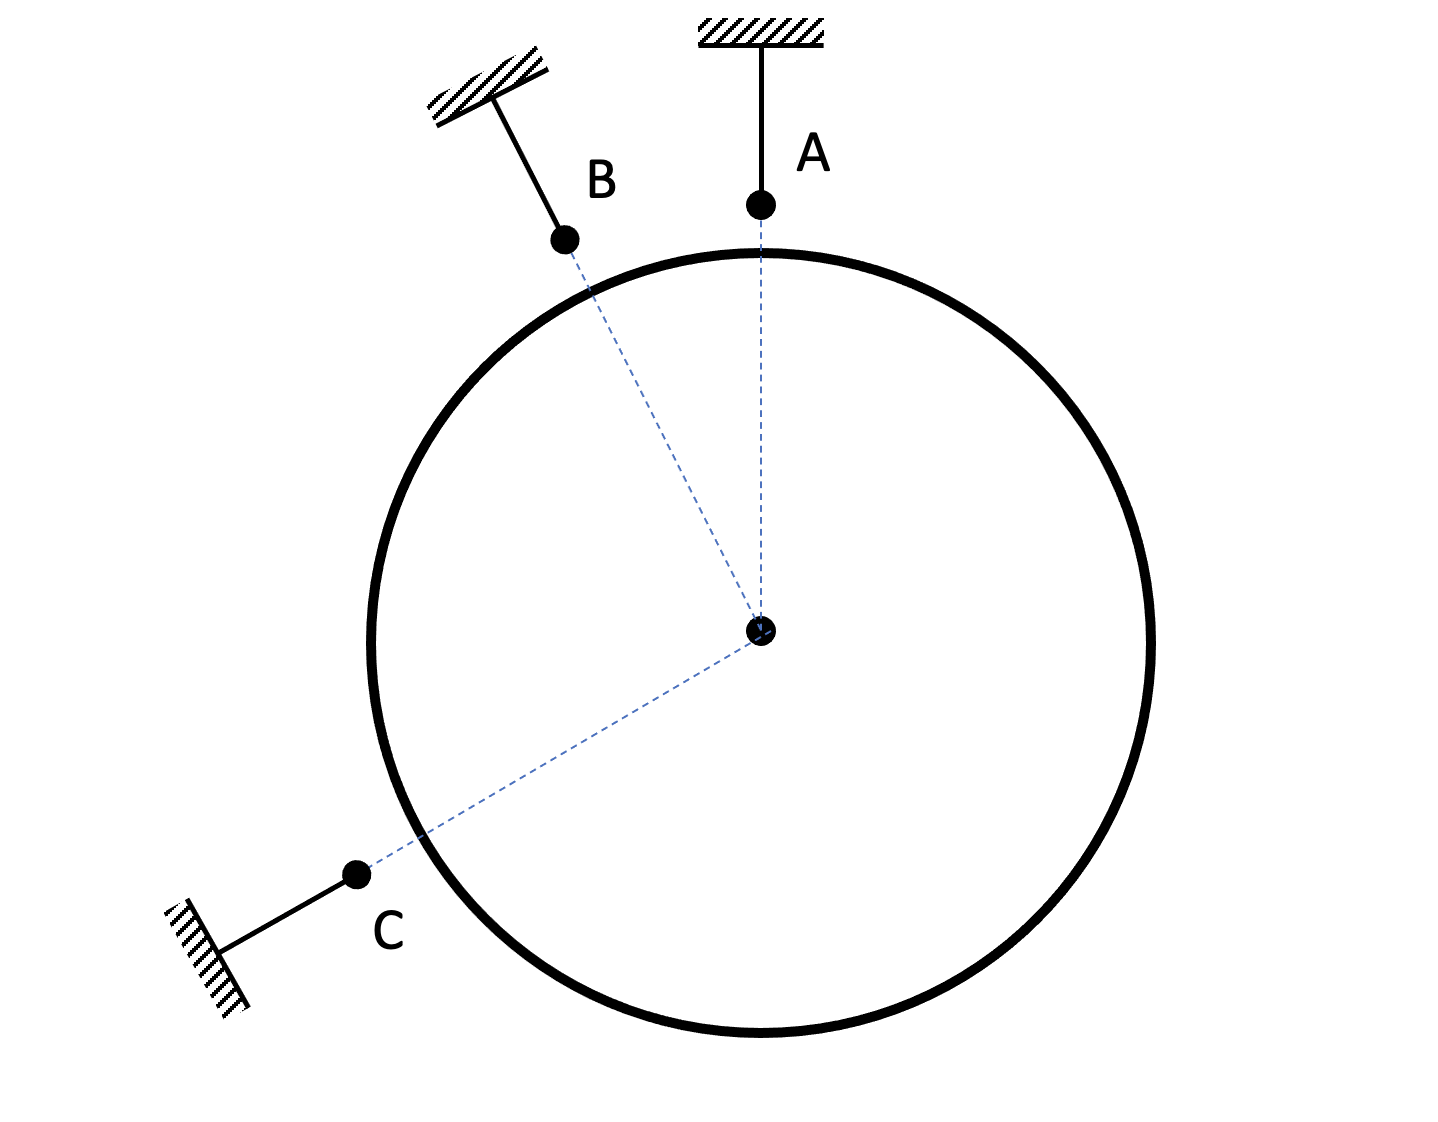
The absolute vertical anywhere on the Earth surface is defined by the direction of the Earth’s gravitational field. It will be a radial line connected with the centre of mass of the planet. The direction of the absolute vertical will be shown by line of a plumb line as shown in the diagram.
Using plumb lines to identify the line of the absolute vertical
(As a short aside, A and B indicate why the towers of the Humber Bridge are 3.6 cm further apart at the top than they are at the bottom. Take that, flat-earthers!)
The local perpendicular
We define the local perpendicular as a line which is at 90o to the plane or surface or table top we are working on. We can find its direction with a set square as shown in the picture below.
Example of when the local perpendicular is aligned with the absolute vertical
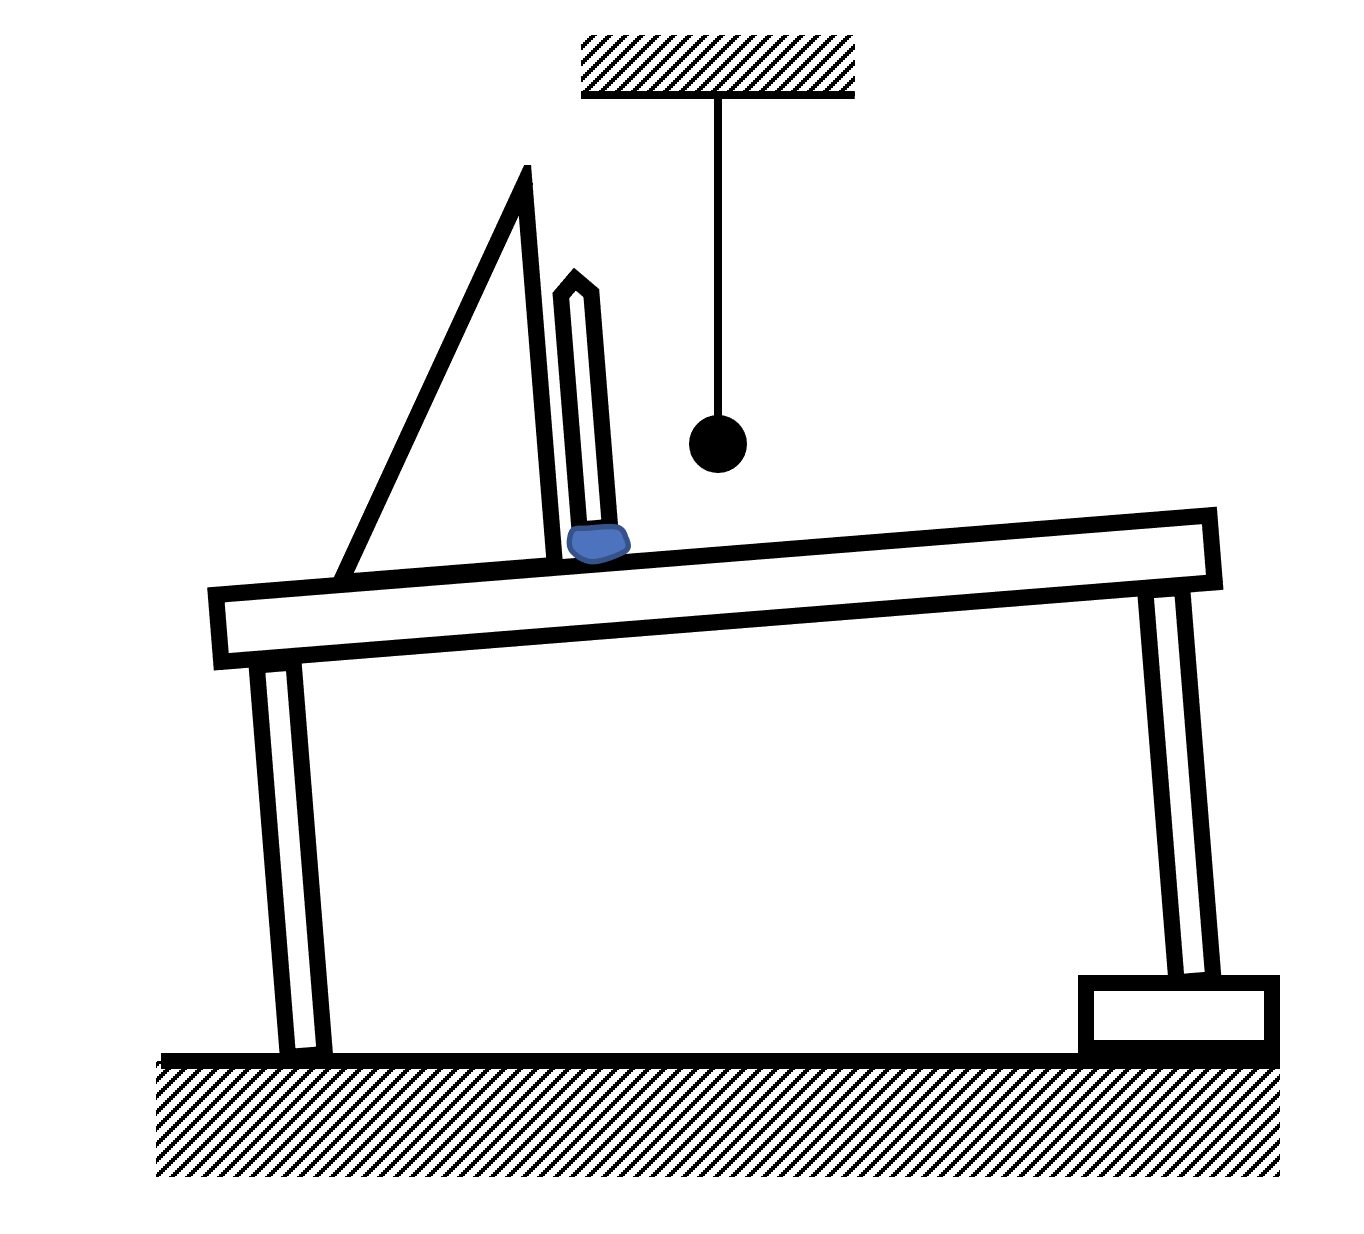
Next we tilt the table so that the local perpendicular and absolute vertical are no longer aligned. (Thanks to my colleague Bruce Pawsey for this idea.)
Example of the local perpendicular and the absolute vertical no longer in alignment.
Forces on a dynamics trolley on an inclined plane (GCSE level analysis)
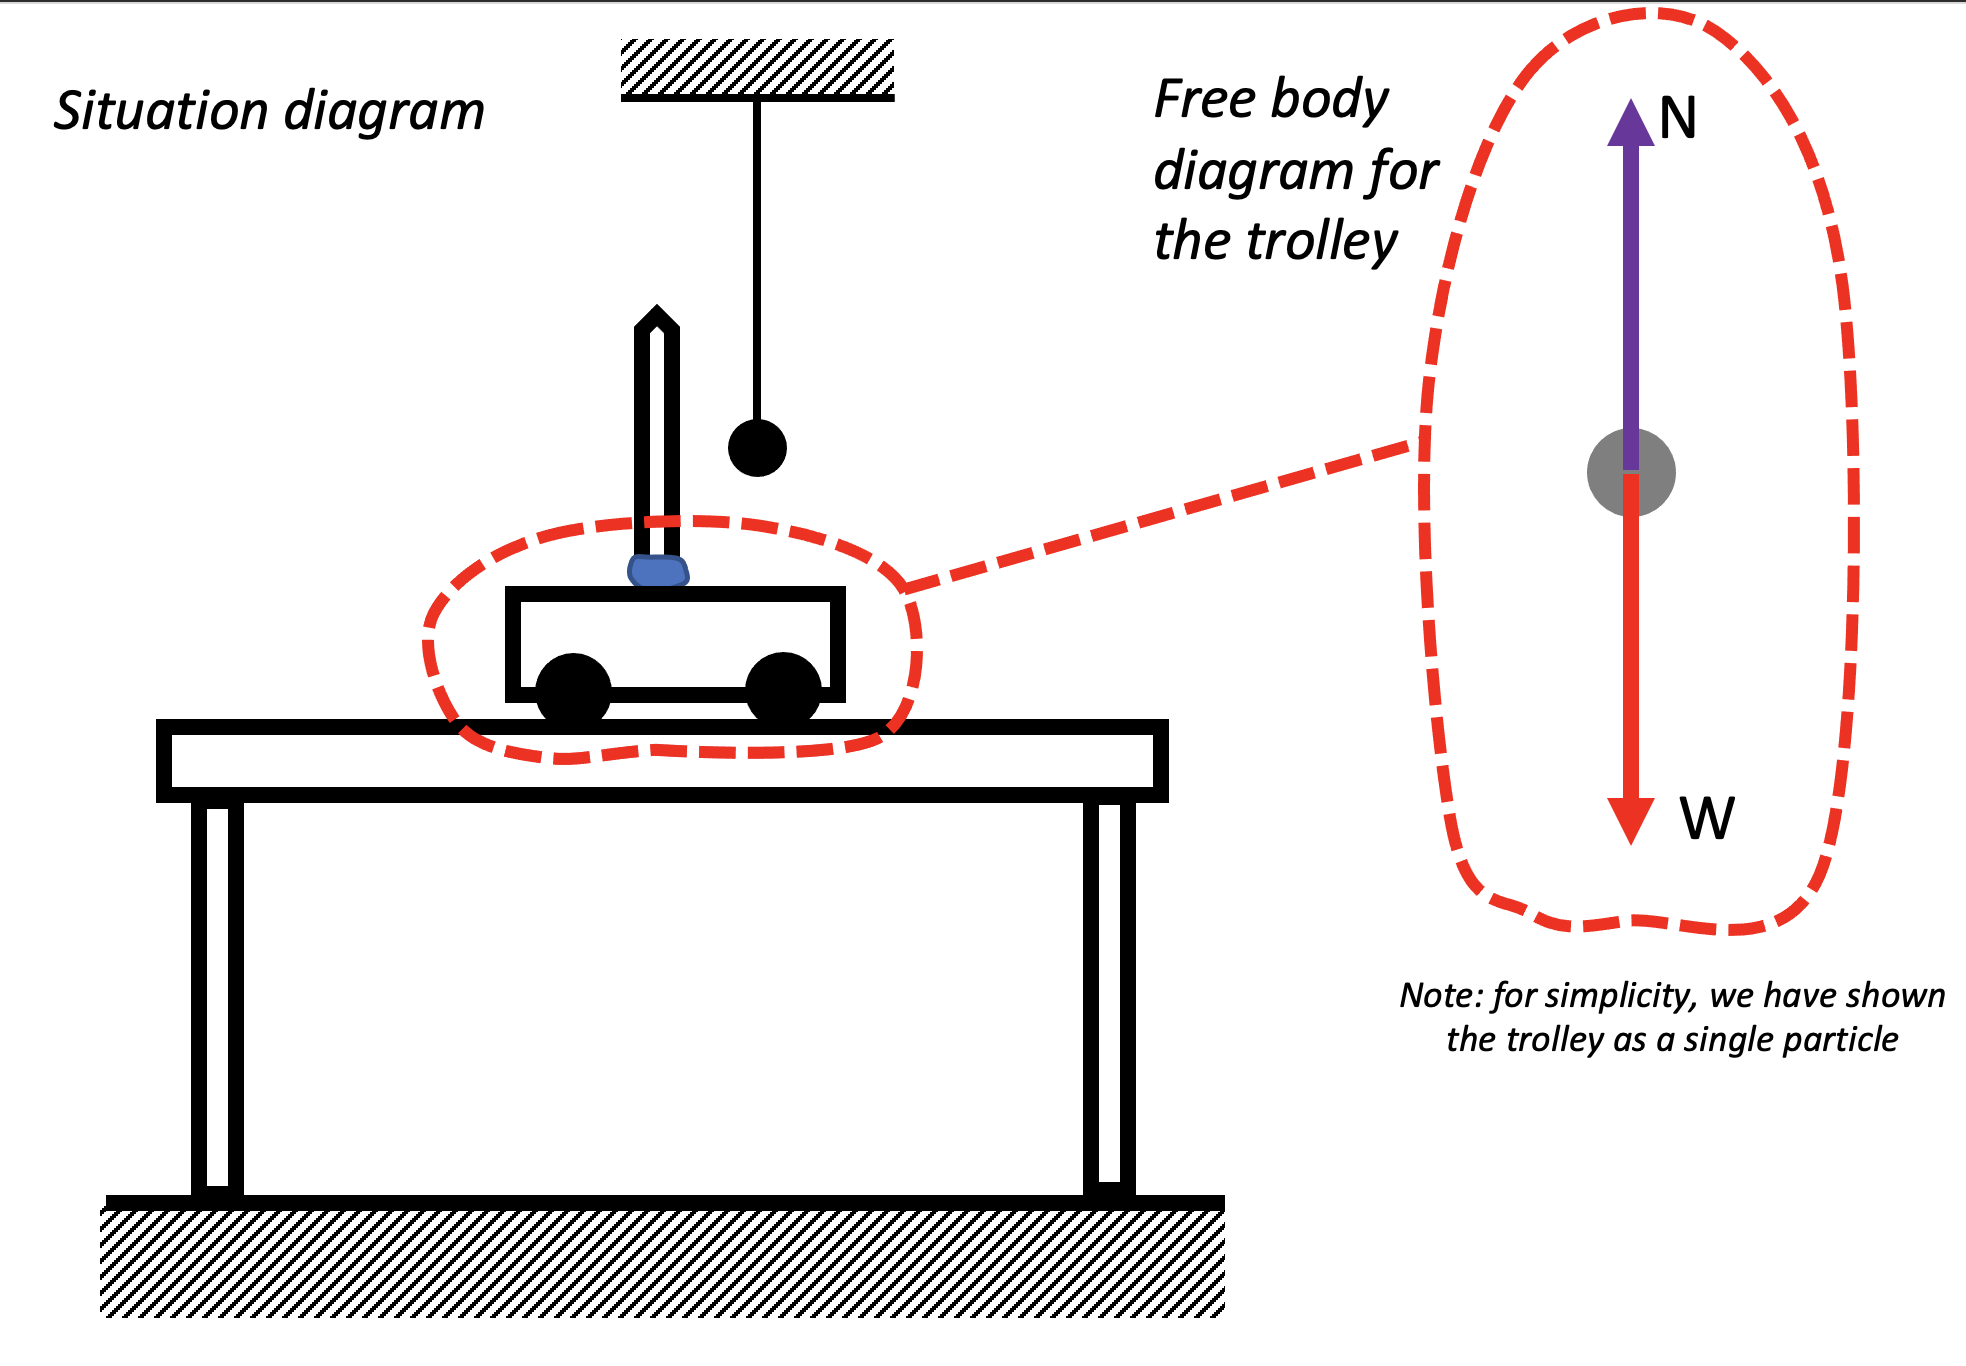
Next we place a dynamics trolley on a horizontal table top. We observe that it is is equilibrium. This is easy to explain if we draw a free body diagram to show the forces on the trolley.
The forces on a trolley on a horizontal surface
The normal reaction force N on the trolley is equal and opposite to the weight W of the trolley. The resultant (total) force on the trolley is zero so it is not accelerating.
But now note what happens if we tilt the table so that it becomes an inclined plane: the trolley accelerates to the left.
At GCSE, it is probably best to restrict the analysis to what happens in the absolute vertical (shown by the plumb line) and the absolute horizontal (at 90o to the plumb line).
If we resolve the normal reaction force into two components, we see that N has a small horizontal component (see above). This is the resultant force that causes the trolley to accelerate to the left as shown.
Forces on an object on an inclined plane (A level analysis for static equilibrium)
If we flip the trolley so that it is upside down, then there will be a frictional force acting parallel to the slope. This means that, as long as the angle of tilt is not too steep, the object will be in equilibrium.
It now makes sense to resolve W into components parallel and perpendicular to the slope, since it is the only force of the three which is aligned with the absolute vertical. F and W are aligned with the local perpendicular and horizontal to it’s less onerous to use these as the ‘reference’ grid in this instance.
The normal reaction force N is equal to W cos 𝜃 not W and since cos 𝜃 is always less than 1 (for angles other than 90o). If we placed the trolley on some digital scales then the reading on the scales would decrease as we increased 𝜃.
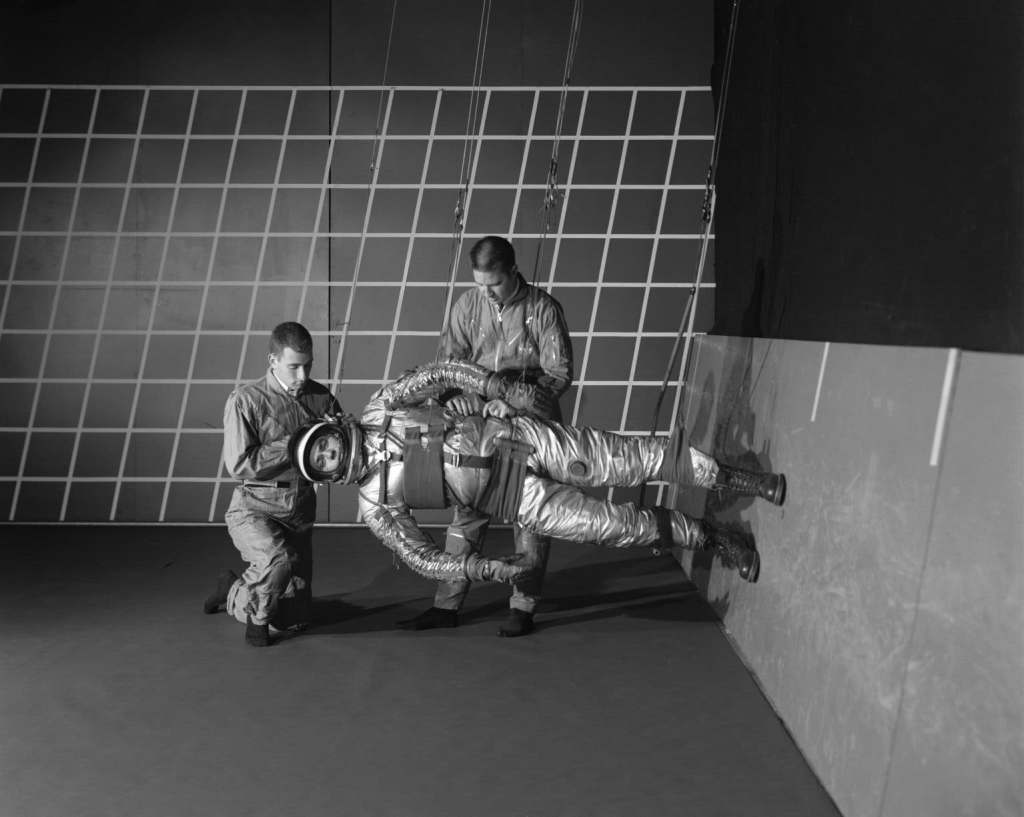
This effect was used to simulate the lower gravitational field strength on the Moon for training astronauts for the Apollo programme. In effect, they trained on an inclined plane. (‘To attain the Moon’s terrain / One trains mainly on an inclined plane.‘)
If the wheels of the trolley were in contact with the table surface so that the frictional force were negligible, then the trolley would accelerate down the slope because of the resultant force of W sin 𝜃 parallel to the slope. The direction of the acceleration is parallel to the slope (i.e. at 90o to the local perpendicular) and not along the absolute horizontal as suggested by the earlier, simpler GCSE-level analysis in the previous section.
You can read Part 1 which introduces the idea of free body force diagrams here.
Essentially the technique we will use is as follows:
Draw a situation diagram with NO FORCE ARROWS.
‘Now let’s look at the forces acting on just object 1’ and draw a separate free body diagram (i.e. a diagram showing just object 1 and the forces acting on it)
Repeat step 2 for some or all of the other objects at your discretion.
(Optional) Link all the diagrams with dotted lines to emphasise that they are facets of a more complex, nuanced whole
The Wheel Thing
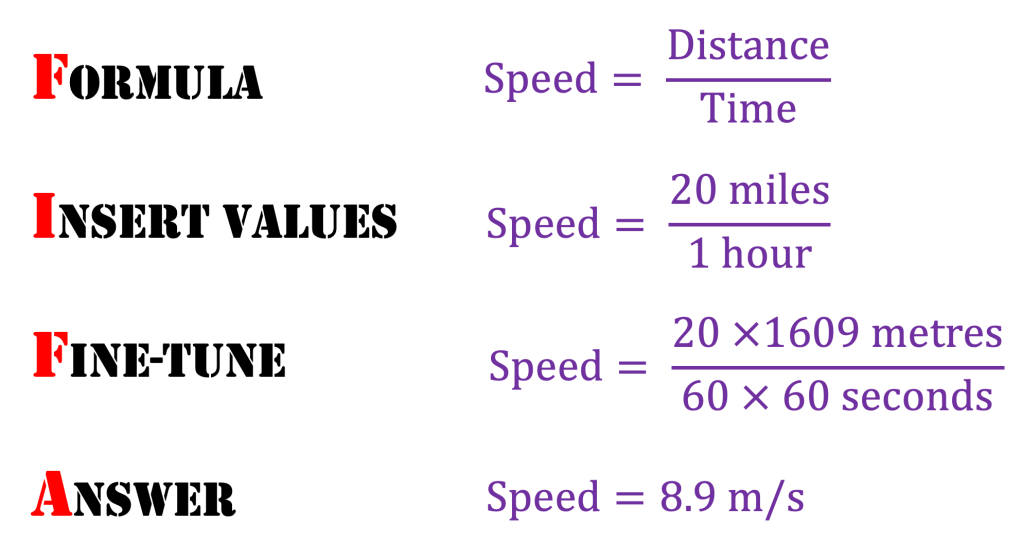
Let’s consider a car travelling at a constant velocity of 20 miles per hour.
NOT a force diagram. (Note: whilst force arrows on situation diagrams should be discouraged, there is no equivalent argument for speed arrows)
’20 m.p.h.’ is such an uncivilised unit so let’s use the FIFA system to change it into more civilised scientific S.I. units:
NOT a force diagram! (Note: it is fine to draw speed/velocity/acceleration arrows on a situation diagram, but not force arrows.)
Note that point A on the car tyre is moving at 8.9 m/s due to the rotation of the wheel, as well as moving at 8.9 m/s with the rest of the car. This means that point A is moving at 8.9 + 8.9 = 17.8 m/s relative to the ground.
More strangely, point B on the car tyre is moving backwards at speed of 8.9 m/s due to the rotation of the wheel, as well as moving forwards at 8.9 m/s with the rest of the car. Point B is therefore momentarily stationary with respect to the ground.
The tyres can therefore ‘grip’ the road surface because the contact points on each tyre are stationary with respect to the road surface for the moment that they are in position B. If this was not the case, then the car would be difficult to control as it would be in a skid.
(Apologies for emphasising this point — I personally find it incredibly counterintuitive! Who says wheels are not technologically advanced!)
Forces on a tyre
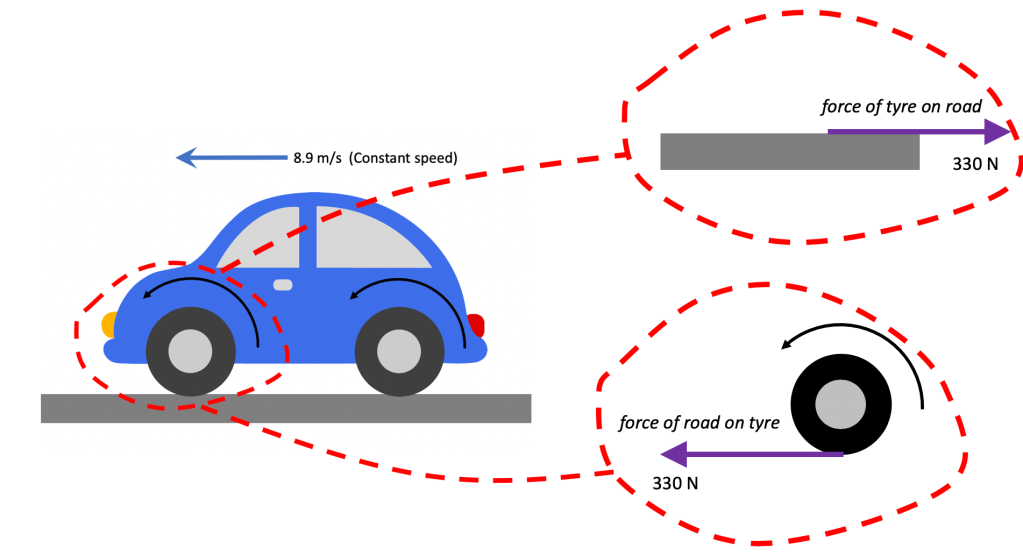
Situation diagram (note: no force arrows) and free body diagrams for road and tyre. Note also different style of arrow for speed and force.
Assuming the car in the diagram is a four wheel drive, the total force driving it forward would be 4 x 330 N = 1320 N. Since it is travelling at a constant speed, this means that there is zero resultant force (or total force). We can therefore infer that the total resistive force acting on the car is 1320 N.
It is can also be slightly disconcerting that the force driving the car forward is a frictional force because we usually speak of frictional forces having a tendency to ‘oppose motion’.
And so they are in this case also. The movement they are opposing is the relative motion between the tyre surface and the road. Reduce the frictional force between the road with oil or mud, and the tyre would not ‘lock’ on the surface and instead would ‘spin’ in place. It’s worth bearing in mind (and communicating to students) that the tread pattern on the tyre is designed to maximise the frictional force between the tyre surface and the road
And then a step to the right…
It’s just a jump to the left
And then a step to the right
The Time Warp, Rocky Horror Picture Show
Situation diagram for a person taking a step to the right; and free body diagrams for the person and the floor
We can see how important friction is for taking a step forward in the above diagrams. Again, it is worth pointing out to students how much effort goes into designing the ‘tread’ on certain types of footwear so as to maximise the frictional force. On climbing boots, the ‘tread’ extends on to the upper surface of the boot for that very reason.
A climbing boot
One step beyond
Let’s apply a similar analysis to the case of a person stepping off a boat that happens not be tied to the mooring.
Situation diagram for a person stepping off an unmoored boat; and free body force diagrams for the person and the boat. Note different style of arrow for forces and acceleration.
The person pushes back on the boat (gripping the boat with friction as above). By Newton’s Third Law, this generates an equal an opposite force on the boat. There is no horizontal force to the right due to the tension in the rope, since there is no rope(!) This means that there is a resultant force on the boat to the left so the boat accelerates to the left.
The forces on the person and the boat will be equal in magnitude, but the acceleration will depend on the mass of each object from F = ma.
Since the boat (e.g. a rowing boat) is likely to have a smaller mass than the person, its acceleration to the left will be higher in magnitude than the acceleration of the person to the right — which will lead to the unfortunate consequence shown below.
The effect of stepping off an unmoored boat
The acceleration of the person and the boat happens only when the person and boat are in contact with each other, since this is the only time when there will be a resultant force in the horizontal direction.
Note that although force arrows on a situation diagram should be discouraged for the sake of clarity, there is an argument for drawing velocity and acceleration arrows on the situation diagram as a form of dual coding. Further details can be found here, and an explanation of why acceleration is shown as a double headed arrow.
The velocity to the left built up by the boat in this short instant will be greater than the velocity to the right built up by the person, because the acceleration of the boat is greater, as argued above.
The outcome, of course, is that the person falls in the water, which has been the subject of countless You’ve Been Framed clips.
Next post…
In the next post, I will try to move beyond horizontal forces and take account of the normal reaction force when an object rests on both horizontal surfaces and inclined surfaces.
Why do so many students hold pernicious and persistent misconceptions about forces?
Partly, I think, because of the apparent clash between our intuitive, gut-level knowledge of real world physics. For example, a typical student might find the statement ‘If I push this box, it will stop moving shortly after I stop pushingbecause force is needed to move things‘ entirely unobjectionable; whilst in the theoretical, rarefied world of the physicist the statement ‘The box will keep moving at a constant velocity after I stop pushing it, unless it is acted on by a resultant force such as friction‘ would get a tick whereas the former would get a big angry X and and a darkly muttered comment about ‘bloody Aristotleans.’
After all, ‘pernicious’ is in the eye of the beholder. Physics teachers have to remember that they suffer mightily under the ‘curse of knowledge’ and have forgotten what it’s like to look at the world through anything than the lens of Newtonian mechanics.
We learn about the world through the power of example. Human beings are ‘inference engines’: we strive to make sense of the world by constructing general rules based on the examples presented to us.
Many of the examples of forces in action presented to students are in the form of force diagrams; and in my experience, all too many force diagrams add to students’ confusion.
A bad force diagram
Force Diagram 1: version 1 (really bad)
Over the years, I have seen many versions of this diagram. To my own chagrin, I must admit that I, personally, have drawn versions of this diagram in the past. But I now recognise it has one major, irredeemable flaw: the arrows are drawn hanging in mid-air.
OK, let’s address this. Is this better?
Force Diagram 1: version 2 (still bad)
No, it isn’t because it is still unclear which forces are acting on which object. Is the blue 75 N arrow the person pushing the cart forward or the cart pulling the person forward? Is the red 75 N arrow the cart pushing back on the person or the person pulling back on the cart?
From both versions of this diagram shown above: we simply cannot tell.
As a consequence, I think the explanatory value of this diagram is limited.
Free Body Diagrams to the Rescue!
A free body diagram is simply one where we consider the forces on each object in the situation in turn.
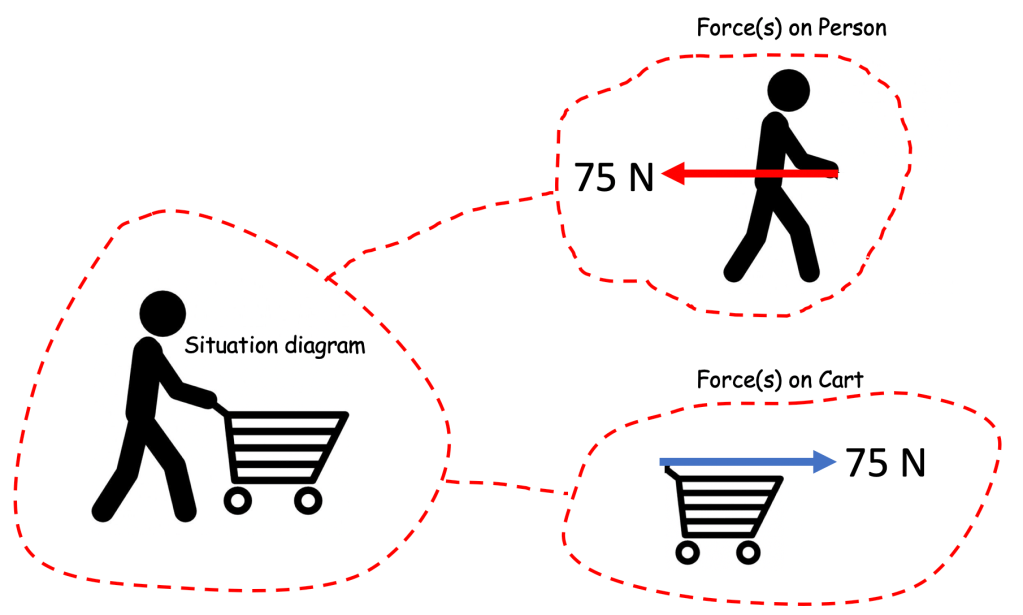
Force Diagram 1: version 3 (much better!)
We begin with a situation diagram. This shows the relationship between the objects we are considering. Next, we draw a free body diagram for each object; that is, we draw each object involved and consider the forces acting on it.
From version 3 of Force Diagram 1, we can see that it was an attempt to illustrate Newton’s Third Law i.e. that if body A exerts a force on body B then body B exerts an equal and opposite force on body A.
Another bad force diagram
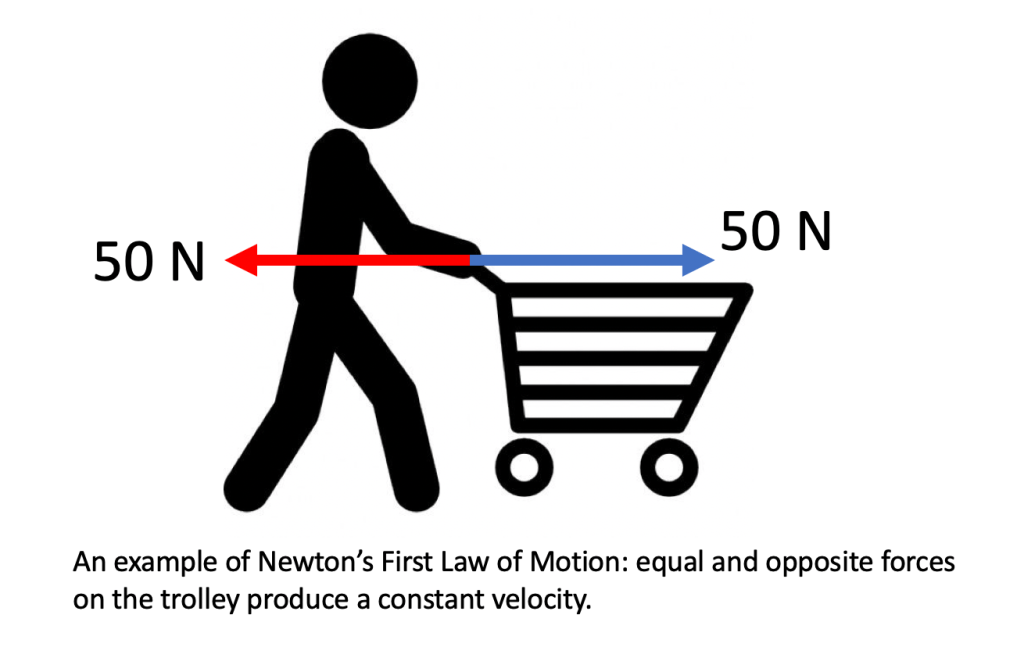
Force Diagram 2: version 1 (very bad)
This is a bad force diagram because it is unclear which forces are acting on the cart and which are acting on the person. Apart from a very general ‘Well, 50 N minus 50 N means zero resultant force so zero acceleration’, there is not a lot of information that can be extracted from this diagram.
Also, the most likely mechanism to produce the red retarding force of 50 N is friction between the wheels of the cart and the ground (and note that since the cart is being pushed by an external body and the wheels are not powered like those of a car, the frictional force opposes the motion). Showing this force acting on the handle of the cart is not helpful, in my opinion.
Free body diagrams to the rescue (again)!
The Newton 3 pairs are colour coded. For example, the orange 50 N forward force on the person (object A) is produced as a direct result of Newton’s 3rd Law because the person’s foot is using friction to grip the floor surface (object B) and push backwards on it (the orange arrow in the bottom diagram).
This diagram shows a complete free body diagram body analysis for all three objects (cart, person, floor) involved in this simple interaction.
I’m not suggesting that all three free body diagrams always need to be discussed. For example, at KS3 the discussion might be limited at the teacher’s discretion to the top ‘Forces on Cart’ diagram as an example of Newton’s First Law in action. Or equally, the teacher may wish to extend the analysis to include the second and third diagrams, depending on their own judgement of their students’ understanding. The Key Stage ticks and crosses on the diagram are indicative suggestions only.
At KS3 and KS4, there is not a pressing need to explicitly label this technique as ‘free body force diagrams’. Instead, what I suggest (perhaps after drawing the situation diagram without any force arrows on it) is the simple statement that ‘OK, let’s look at the forces acting on just the cart’ before drawing the top diagram. Further diagrams can be introduced with a similar statements such as ‘Next, let’s look at the forces acting on just the person’ and so on. Linking the diagrams with dotted lines as shown is, I think, useful in not losing sight of the fact that we are dealing piecemeal with a complex and nuanced whole.
Conclusion
The free body force diagram technique (whether or not the teacher decides to explicitly call it that) offers a useful tool that will allow us all to (fingers crossed!) draw better force diagrams.
Draw a situation diagram with NO FORCE ARROWS.
‘Now let’s look at the forces acting on just object 1’ and draw a separate free body diagram (i.e. a diagram showing just object 1 and the forces acting on it)
Repeat step 2 for some or all of the other objects at your discretion.
(Optional) Link all the diagrams with dotted lines to emphasise that they are facets of a more complex, nuanced whole
In the next post, I hope to show how the technique can be used to explain common problems such as how a car tyre interacts with the ground to drive a car forward.