“The most miserable latch that’s ever been designed in the history of mankind or before.”
Astronaut Jack R. Lousma commenting on some equipment issues during the NASA Skylab 3 mission (July to September 1973), quoted in Cooper 1976: 41
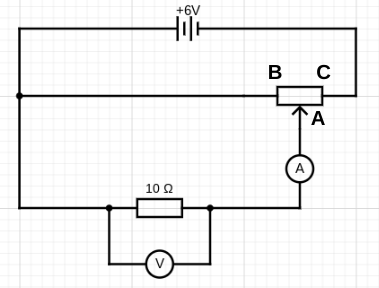
What does the worst circuit that’s ever been designed in the history of humankind or before look like? Without further ado, here it is:

‘But wait,’ I hear you say, ‘isn’t this the circuit intended for obtaining the data for plotting current-potential difference characteristic curves as recommended by the AQA exam board in their GCSE Physics and GCSE Combined Science specifications?’ (AQA 2018: 47)
Sadly, it is indeed.
Why is ‘the standard test circuit’ a *bad* circuit?
The point of this required practical is to get several paired readings of potential difference across a component and the current through a component to enable us to plot a graph (aka ‘characteristic’) of current against potential difference. Ideally, we would like to start at 0.0 volts across the resistor and measure the current at (say) 1.0, 2.0, 3.0, 4.0, 5.0 and 6.0 volts. That is to say, we would like to treat the potential difference as the independent variable and adjust it in consistent, regular increments.
Now let’s say we use a typical school rheostat such as the one shown below as the variable resistor in series with the 10 ohm resistor. The two of them will behave as a potential divider circuit (see here and here for posts on this topic).
The resistance of the variable resistor can be varied between 0 and 16 ohms by moving the slider. When the slider is at A it will have the maximum resistance of 16 ohms and zero when it is at C, and in-between values at any other point.

When the slider is at C, the 10 ohm resistor gets the full potential difference from the supply and so the voltmeter will read 6.0 V and the ammeter will read (using I=V/R) 6.0 / 10 = 0.6 amps.
When the slider is at A, the total resistance of the circuit is 10 + 16 = 26 ohms so the ammeter reading (again using I=V/R) will be 6.0/26 = 0.23 amps. This means that the voltmeter reading (using V=IR) will be 0.23 x 10 = 2.3 volts.
This means that the circuit as presented will only allow us to obtain potential differences between a minimum of 2.3 V and a maximum of 6.0 V across the component by moving the slider between B and C, which is less than ideal.
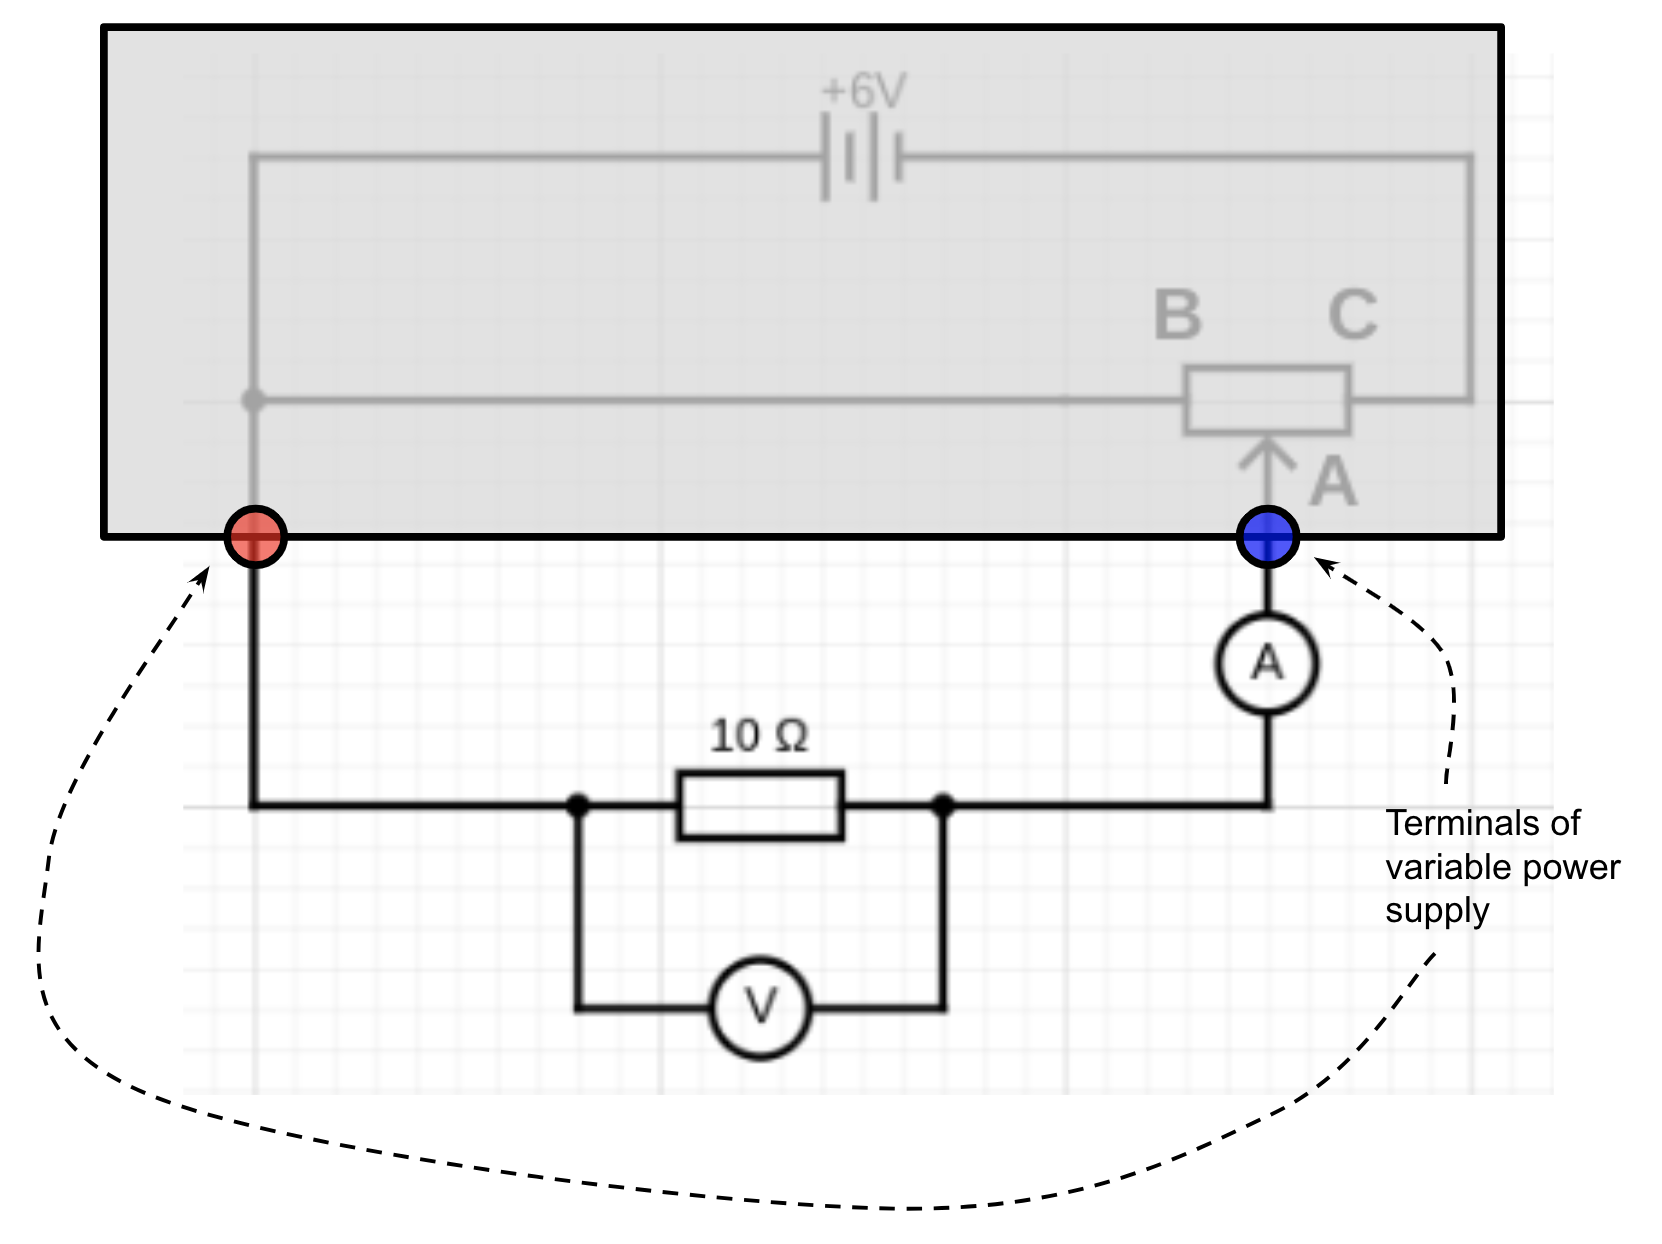
‘It is a far, far better circuit that I build than I have ever built before…’
It is a far, far better thing that I do, than I have ever done.
Charles Dickens, ‘A Tale of Two Cities’
This circuit is a far better one for obtaining the data for a current-potential difference graph. This is because we can access the full 0.0 V to 6.0 V of the supply simply by adjusting the position of the rheostat slider. The rheostat is being used as a potential divider in this circuit rather than as a simple variable resistor.
When the slider is at B, the voltmeter will read 0.0 V and the current through the 10 ohm resistor will be 0.0 amps. A small movement of the slider from B towards C will increase the reading of the voltmeter to (say) 1.0 V and the ammeter would read 0.1 A. Further small movements of the slider will gradually increase the potential difference across the resistor until it reaches the full 6.0 V when the slider is at C.
A-level Physics students are expected to be able to use this circuit and enumerate its advantages over the ‘worst circuit in the world’.
And, to be fair, AQA do suggest a workaround that will allow GCSE student to side-step using ‘the worst circuit in the world’:
If a lab pack is used for the power supply this can remove the need for the rheostat as the potential difference can be varied directly. The voltage should not be allowed to get so high as to damage the components, check the rating of the components you plan to suggest your students use.
AQA 2018: 16
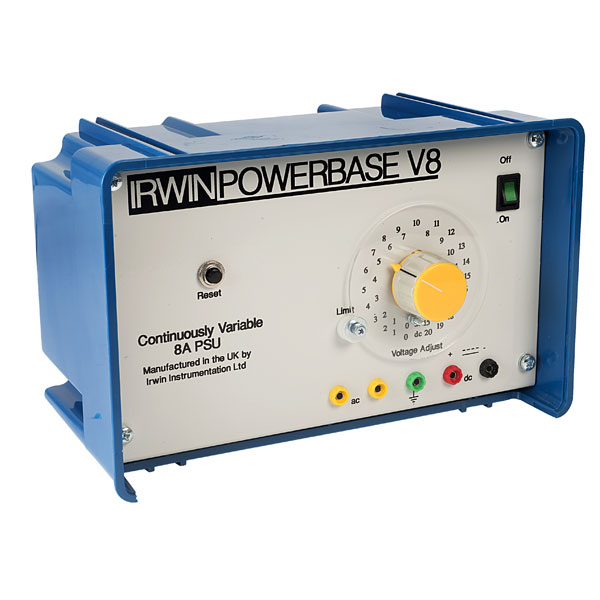
If this method is used, then in effect you would be using the ‘built in’ rheostat inside the power supply.
So why not use the superior potential divider circuit at GCSE?
The arguments in favour of using ‘the worst circuit in the world’ as opposed to the more fit for purpose potential divider circuit are:
- The ‘worst circuit in the world’ is (arguably) conceptually easier than the potential divider circuit, especially if students have not studied series and parallel circuit before. This allows more freedom in sequencing when IV characteristics are taught.
- A fuller range of potential differences can be accessed even using the ‘worst circuit in the world’ if the maximum value of the variable resistor is much larger than the resistance of the component. For example, if we used a 0 – 1 kilo-ohm variable resistor in series with the 10 ohm resistor then very fine adjustments of the variable resistor would allow a suitable range of potential difference to be applied across the component.
- Students are often asked direct questions about the ‘worst circuit in world’.

In the next post, I will outline how I introduce and teach this required practical — using, to my shame, ‘the worst circuit in the world’ — and also supply some useful resources.
You can read part 2 here.
REFERENCES
AQA (2018). Practical Handbook: GCSE Physics. Retrieved from https://filestore.aqa.org.uk/resources/physics/AQA-8463-PRACTICALS-HB.PDF on 7/5/23
Cooper, H. S. F. (1976). A House In Space. New York: Bantam Books

Surely, Emerson or Cicero could have died to this. ILYF xxxx
Perhaps, but what I have always said is that the only trouble with Emerson and Cicero is that their collected works are deplorably light on physics! ILYE xxxx
Alas, this is not the worst. Scroll down to page 48 in the Handbook (page 50 in the PDF) where the same circuit is used for the characteristic of a diode – this is exponentially worse. It gives the ‘correct’ characteristic with a knee at about 0.7V – just what the examiner expects.
Reversing the supply will just measure the current through the voltmeter (which should be moved to avoid this).
I have done some tests to determine the best way to do this experiment (see link) and the one using the simple potential divider works very well as the plot shows – a nice smooth exponential as theory predicts (it does go up at the end due to temperature rise).
Click to access g-i-v-characteristics.pdf
Your point is conceded! The ‘standard test circuit’ with the diode probably *is* the worst circuit in the world!
The IV characteristic paper you attach seems admirably comprehensive. The ‘component tester’ terminal on some CROs was news to me — I previously didn’t even suspect that this functionality existed. I look forward to giving it a go.
Much of the paper was, I regret to admit, a little above my very rusty state of electronics knowledge; your criticisms of the working of the Data Harvest sensors were a bit of an eye opener. I usually hold the default ‘black box’ assumption that manufacturers know what they’re doing and the tech is reliable. That said, I rarely use current and voltage datalogging sensors. The only context in where I think they are absolutely essential at GCSE/A-level is the ‘dropping a bar magnet through a coil’ practical.
I’m relieved to learn that the ‘potential divider’ arrangement produces valid results as this would be by default approach. It’s nice to know that my instincts aren’t entirely unsound(!)
Since it is already agreed that this circuit is very bad for measuring the IV characteristic of a diode. I have only some peripheral comments to add.
The first is about „keeping the temperature of the resistor constant. This is strictly speaking very unlikely to happen because the power dissipated in the resistor is of course increased as the current increases. Without efforts to increase cooling as current is increased this dissipated power raises the temperature of the resistor until a new equilibrium between rate of energy transfer to surroundings and rate of electrical work done in resistor is reached.
The other point is that variable power supplies (the ones I have opened) use variable transformers, not resistors in a potential divider to vary output pd.
It probably is not of much concern in a school context but rheostats are inherently wasteful because more than half the current from the supply is just used to warm the rheostat.
The other option for controlling output voltage would be pulse width modulation, but that definitely goes beyond the school curriculum.
I have bought a very smooth digitally regulated PSU to be able to demonstrate IV characteristics quickly on a datalogger, most others have too much of the AC ripple to be useable for this.
Lastly I want to point out that the curve for the filament bulb shown in textbooks and gcse question papers is of course a fabrication, actual measurements have a fairly steep rise followed by an almost straight line at lower gradient, i.e. not passing through the 0/0 point and therefore not showing a constant V/I ratio, i.e. not „directly proportional“. I mention that because this makes it worth while to resolve the graph with closely spaced measurements at low voltages, exactly what the variable resistor circuit does not enable.
I am a science technician and I love that someone else feels as passionately about this as I do. In my mind – and I am pretty maths literate – calculating anything in this circuit (for example, for me to select components to supply to class) is a massive pain in the a$$.
You are essentially varying everything at once, which makes the maths actually more confusing, and as others have said, miss out the important feature of the diode as you cannot get low enough V.
I appreciate that the parallel set up may be unfamiliar, but it instantly means you are only varying one feature in the circuit at at time and looking at the effect of that one variation.
If it confuses me (I have an mech eng degree and was only fair at electronics if I am honest!) then surely it must confuse any student that thinks slightly further than “move slider, take readings”
I am so glad this post gets like-minded people to come out of the woodwork😄 I mean, if you want to simplify, just put a variable power supply in place!