
. . . setting storms and billows at defiance, and visiting the remotest parts of the terraqueous globe.
Samuel Johnson, The Rambler, 17 April 1750
That an object in free fall will accelerate towards the centre of our terraqueous globe at a rate of 9.81 metres per second per second is, at best, only a partial and parochial truth. It is 9.81 metres per second per second in the United Kingdom, yes; but the value of both acceleration due to free fall and the gravitational field strength vary from place to place across the globe (and in the SI System of measurement, the two quantities are numerically equal and dimensionally equivalent).
For example, according to Hirt et al. (2013) the lowest value for g on the Earth’s surface is atop Mount Huascarán in Peru where g = 9.7639 m s-2 and the highest is at the surface of the Arctic Ocean where g = 9.8337 m s-2.
Why does g vary?
There are three factors which can affect the local value of g.
Firstly, the distribution of mass within the volume of the Earth. The Earth is not of uniform density and volumes of rock within the crust of especially high or low density could affect g at the surface. The density of the rocks comprising the Earth’s crust varies between 2.6 – 2.9 g/cm3 (according to Jones 2007). This is a variation of 10% but the crust only comprises about 1.6% of the Earth’s mass since the density of material in the mantle and core is far higher so the variation in g due this factor is probably of the order of 0.2%.
Secondly, the Earth is not a perfect sphere but rather an oblate spheroid that bulges at the equator so that the equatorial radius is 6378 km but the polar radius is 6357 km. This is a variation of 0.33% but since the gravitational force is proportional to 1/r2 let’s assume that this accounts for a possible variation of the order of 0.7% in the value of g.
Thirdly, the acceleration due to the rotation of the Earth. We will look in detail at the theory underlying this in a moment, but from our rough and ready calculations above, it would seem that this is the major factor accounting for any variation in g: that is to say, g is a minimum at the equator and a maximum at the poles because of the Earth’s rotation.
The Gnome Experiment
In 2012, precision scale manufacturers Kern and Sohn used this well-known variation in the value of g to embark on a highly successful advertising campaign they called the ‘Gnome Experiment’ (see link 1 and link 2).
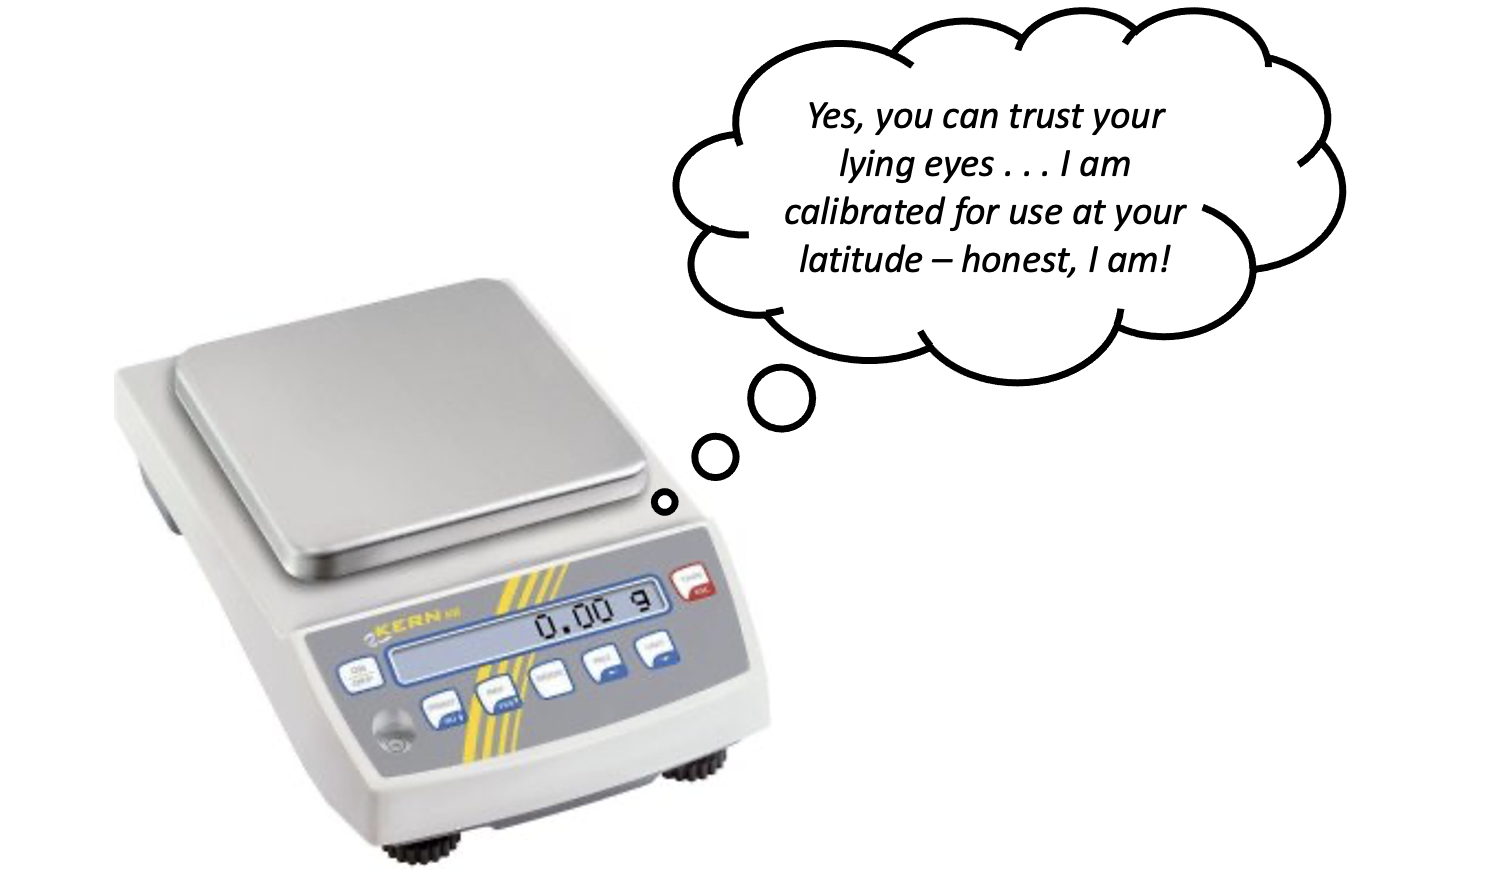
Whatever units their lying LCD displays show, electronic scales don’t measure mass or even weight: they actually measure the reaction force the scales exert on the item in their top pan. The reading will be affected if the scales are accelerating.

In diagram B, the apple and scales are in an elevator that is accelerating upward at 1.00 metres per second per second. The resultant upward force must therefore be larger than the downward weight as shown in the free body diagram. The scales show a reading of 1.081/9.81 – 0.110 194 kg = 110.194 g.
In diagram C, the the apple and scales are in an elevator that is accelerating downwards at 1.00 metres per second per second. The resultant upward force must therefore be smaller than the downward weight as shown in the free body diagram. The scales show a reading of 0.881/9.81 – 0.089 806 kg = 89.806 g.
Never mind the weight, feel the acceleration
Now let’s look at the situation the Kern gnome mentioned above. The gnome was measured to have a ‘mass’ (or ‘reaction force’ calibrated in grams, really) of 309.82 g at the South Pole.

Showing this situation on a diagram:

Looking at the free body diagram for Kern the Gnome at the equator, we see that his reaction force must be less than his weight in order to produce the required centripetal acceleration towards the centre of the Earth. Assuming the scales are calibrated for the UK this would predict a reading on the scales of 3.029/9.81= 0.30875 kg = 308.75 g.
The actual value recorded at the equator during the Gnome Experiment was 307.86 g, a discrepancy of 0.3% which would suggest a contribution from one or both of the first two factors affecting g as discussed at the beginning of this post.
Although the work of Hirt et al. (2013) may seem the definitive scientific word on the gravitational environment close to the Earth’s surface, there is great value in taking measurements that are perhaps more directly understandable to check our comprehension: and that I think explains the emotional resonance that many felt in response to the Kern Gnome Experiment. There is a role for the ‘artificer’ as well as the ‘philosopher’ in the scientific enterprise on which humanity has embarked, but perhaps Samuel Johnson put it more eloquently:
The philosopher may very justly be delighted with the extent of his views, the artificer with the readiness of his hands; but let the one remember, that, without mechanical performances, refined speculation is an empty dream, and the other, that, without theoretical reasoning, dexterity is little more than a brute instinct.
Samuel Johnson, The Rambler, 17 April 1750
References
Hirt, C., Claessens, S., Fecher, T., Kuhn, M., Pail, R., & Rexer, M. (2013). New ultrahigh‐resolution picture of Earth’s gravity field. Geophysical research letters, 40(16), 4279-4283.
Jones, F. (2007). Geophysics Foundations: Physical Properties: Density. University of British Columbia website, accessed on 2/5/21.
<

Reblogged this on The Echo Chamber.