After a fascinating discussion led by the excellent Alex Weatherall (click here to participate in his Google doc Physics-fest — and follow @A_Weatherall on Twitter for more), I was thinking on possible teaching approaches for energy.
Although I think the IoP‘s (the UK’s Institute of Physics) approach is conceptually sound (see previous post here) and addresses many of the shortcomings in the traditional and time-hallowed “forms of energy” approach, many Physics teachers (myself included) are struggling to find direct and simple ways of communicating the highly nuanced content to students.
For example, to describe a filament bulb:
A (filament) light bulb is a device that takes energy in (input) through an electrical pathway (the current) to the thermal energy store of the filament (the metal is getting hotter) which transfers the energy through the radiation pathways of light (visible and IR). There is an increase in the thermal store of the room due to transfer via the heating pathway. The less energy transferred by heating compared to visible light the more efficient the light bulb.
I think this is in accordance with the letter and spirit of the “IoP Energy Newspeak” approach; but sadly, I can picture many students struggling to understand this, even though it was written by many hands (including mine) with the best of intentions.
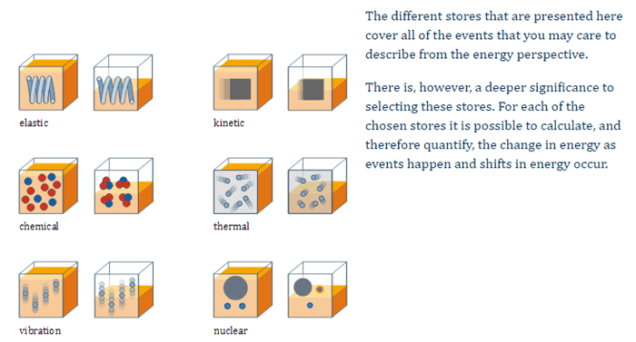
But then I began to think of adopting a diagrammatic “enoji” approach. (See here for suggested energy icons, or energy + emoji = enoji)
Diagrams for Stores and Pathways
An energy store is represented by a “watertight” container. For example, the gravity store of a ball at the top of a slope could be represented thus:

Because it is an energy store, the amount of energy (represented by the level of orange liquid) in the store remains constant. Energy will not spontaneously leave the store. Energy stores don’t have holes. The unit we use with energy stores is the joule.
However, energy pathways do have holes. In contrast to an energy store, the energy level in a pathway will spontaneously decrease as the energy is shifted to another store.
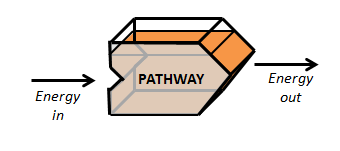
To keep the energy level constant in a pathway, it needs to be constantly “topped up” by the energy from an energy store.
Since a pathway represents a “flow” of energy, the unit we use with an energy pathway is the watt (one joule per second). The “orange liquid level” in the pathway icon could therefore represent the amount of energy flowing through in one second (although I concede that this idea, though promising, needs more thought).
“Enoji Energy Shift” Diagrams
Adopting this convention, the “enoji energy shift” diagram for a ball rolling down a slope might look like this:

An energy store does not have any holes — unless it is linked to a pathway, like the gravity store above. Energy will move in the direction indicated by the energy pathway icon.
Simplified in a student exercise book, it could be represented like this:
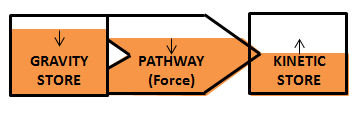
The small upward and downward arrows are an attempt to indicate what happens to the energy level over time.
The Filament Lightbulb “Enoji Energy Shift” Diagram
This could be represented in a student exercise book like this:
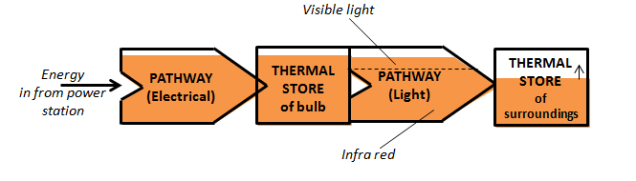
Since there are no small up and down arrows on the pathway or thermal store enojis, this indicates that the energy levels are relatively stable (provided we have a constant input of energy from the power station). However, the energy level of the thermal store of the surroundings just keeps on going up…
And finally…
Please note this is a work in progress.
I fully expect many teachers will think that the suggested set of conventions may well prove more confusing for students.
However, what I am attempting to do is to give students a set of simple, coherent yet serviceable analogies. In other words, this might provide a conceptual “tool kit” of physical representations of very abstract processes involving energy.
I hope readers will agree that it offers some scope for further development. Comments, criticisms and suggestions would be most welcome.