In part one, we looked at the fact that the hotter an object then the greater the intensity of electromagnetic radiation that will be emitted. For simplicity, we looked at so-called ‘blackbodies’ — that is say, objects which are perfect absorbers (hence ‘blackbodies’) and more importantly, perfect emitters of electromagnetic radiation.
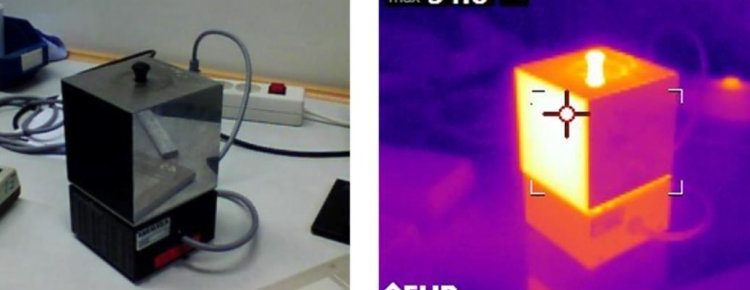
To human eyes, things look very dull in the visible part of the electromagnetic spectrum until we reach temperatures of several hundreds of degrees — however, objects at room temperature (or just above) glow brightly in the infrared part of the electromagnetic spectrum, as we can see easily if we have access to an infrared camera.
By ‘intensity’ of course, we mean the power (‘energy per second’) emitted per unit area.

This links in neatly with 4.6.3.2 of the 2015 AQA GCSE Physics specification:

Stretch and challenge for students (1): Is the intensity of emitted radiation directly proportional to the temperature of the object?
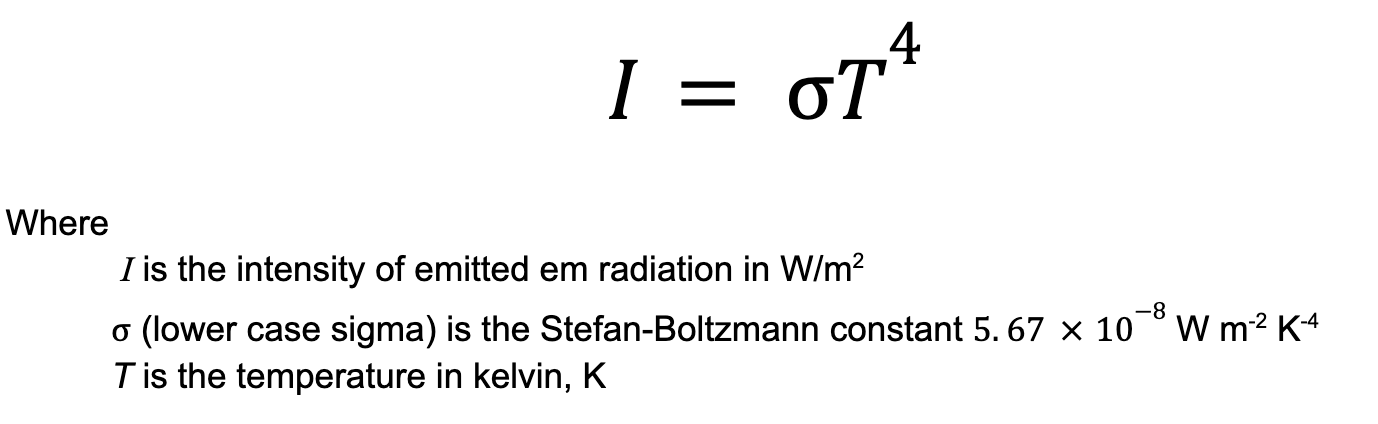
The short answer is no. If you doubled the temperature (measured in kelvins!) of an object then the intensity of radiation would increase by a factor of 16. In other words, the intensity I of radiation emitted by an object is directly proportional to the absolute temperature T raised to the power of 4.
This is a consequence of the Stefan-Boltzmann radiation law (covered in A-level Physics):
In part 1 we estimated the intensity of radiation emitted by two blackbodies by ‘counting squares’ to find the area underneath a graph. We can show that the values obtained are consistent with the Stefan-Boltzmann radiation law.

Since we have dealt comprehensively with the relationship between intensity of radiation and temperature, I propose to move along and look at how the wavelength distribution changes with the temperature of the body.
How does the temperature of a blackbody affect the distribution of emitted wavelengths?
Let’s consider an object that approximates to a blackbody: the filament of an old school incandescent lamp.

The graph of the radiation produced by both objects is shown below.
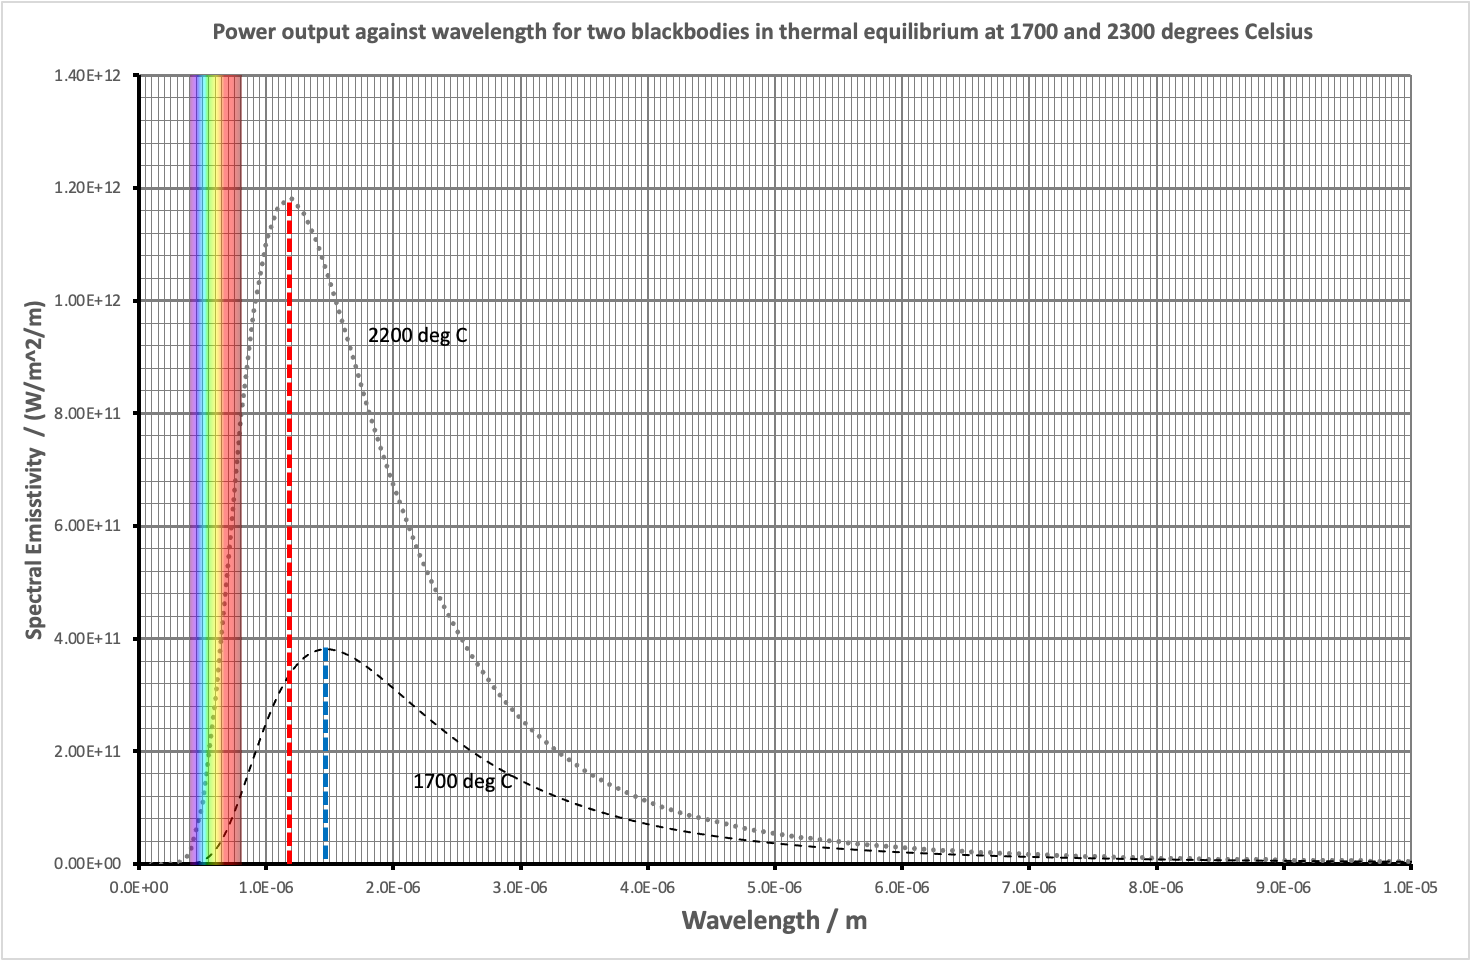
First, let’s look at the visible wavelengths produced by both bulbs.
- The 1700 degree Celsius bulb produces only a very small amount of visible light and the vast majority of that is towards the red end of the spectrum: you can see the section where the left hand edge of the 1700 curve just nicks the visible light wavelengths. This means that the 1700 degree filament emits a barely perceptible reddish glow to our eyes with its peak output still firmly in the infrared.
- The 2200 degree Celsius bulb produces a much larger amount of visible light: look at the left hand side of the curve. What is more, it appears as white light to our eyes since it includes all the colours of the rainbow. However, it’s still a very reddish-tinged white. Photographs taken in artificial light with chemical films (very old school!) had to be taken using special colour balanced film stock otherwise this bias was very evident in the final print(!) Modern digital cameras have software that automatically compensates for artificial vs. daylight colour balance issues.
Second, let’s look at the position of the peak wavelength.
- The 1700 degree Celsius bulb has its peak output at a wavelength of 1.5 x 10⁻⁶ m (shown by the blue dotted line on the graph).
- The 2200 degree Celsius bulb has its peak output at a wavelength of 1.2 x 10⁻⁶ m (shown by the red dotted line on the graph.)
Assuming that you wanted to, these findings could be summarised in song (sung to the tune of ‘Black Betty’ by Ram Jam):
Whoa, black body (Bam-ba-lam)
Whoa, black body (Bam-ba-lam)
More heat, peak shifts left
Waves out with more zest
Wavelengths out not alike
Some hues power spike!
Whoa, black body (Bam-ba-lam)
Whoa, black body
Bam-ba-laaam, yeah yeah
Stretch and challenge for students (2): predicting the position of the peak output wavelength
The position of the peak output wavelength can be predicted using Wien’s Displacement Law (studied in A-level Physics:

As we can see, the peak output wavelength on the graph agrees well with the position as calculated by Wien’s Displacement Law.

An unannotated pdf of the graph can be downloaded here:

Great lighting application …
I like it. I think. Cicero. ILYF xxxx