I don’t want to turn the world upside down — I just want to make it a little bit tilty.
In this post, I want to look at the physics of inclined planes, as this is a topic that can trip up students at GCSE and A-level. I believe that one of the reasons for this is that students often have only a fuzzy notion of what we mean by ‘vertical’ and ‘perpendicular’. These terms are often treated as synonymous so I think they could do with some unpicking.
The absolute vertical
The absolute vertical anywhere on the Earth surface is defined by the direction of the Earth’s gravitational field. It will be a radial line connected with the centre of mass of the planet. The direction of the absolute vertical will be shown by line of a plumb line as shown in the diagram.
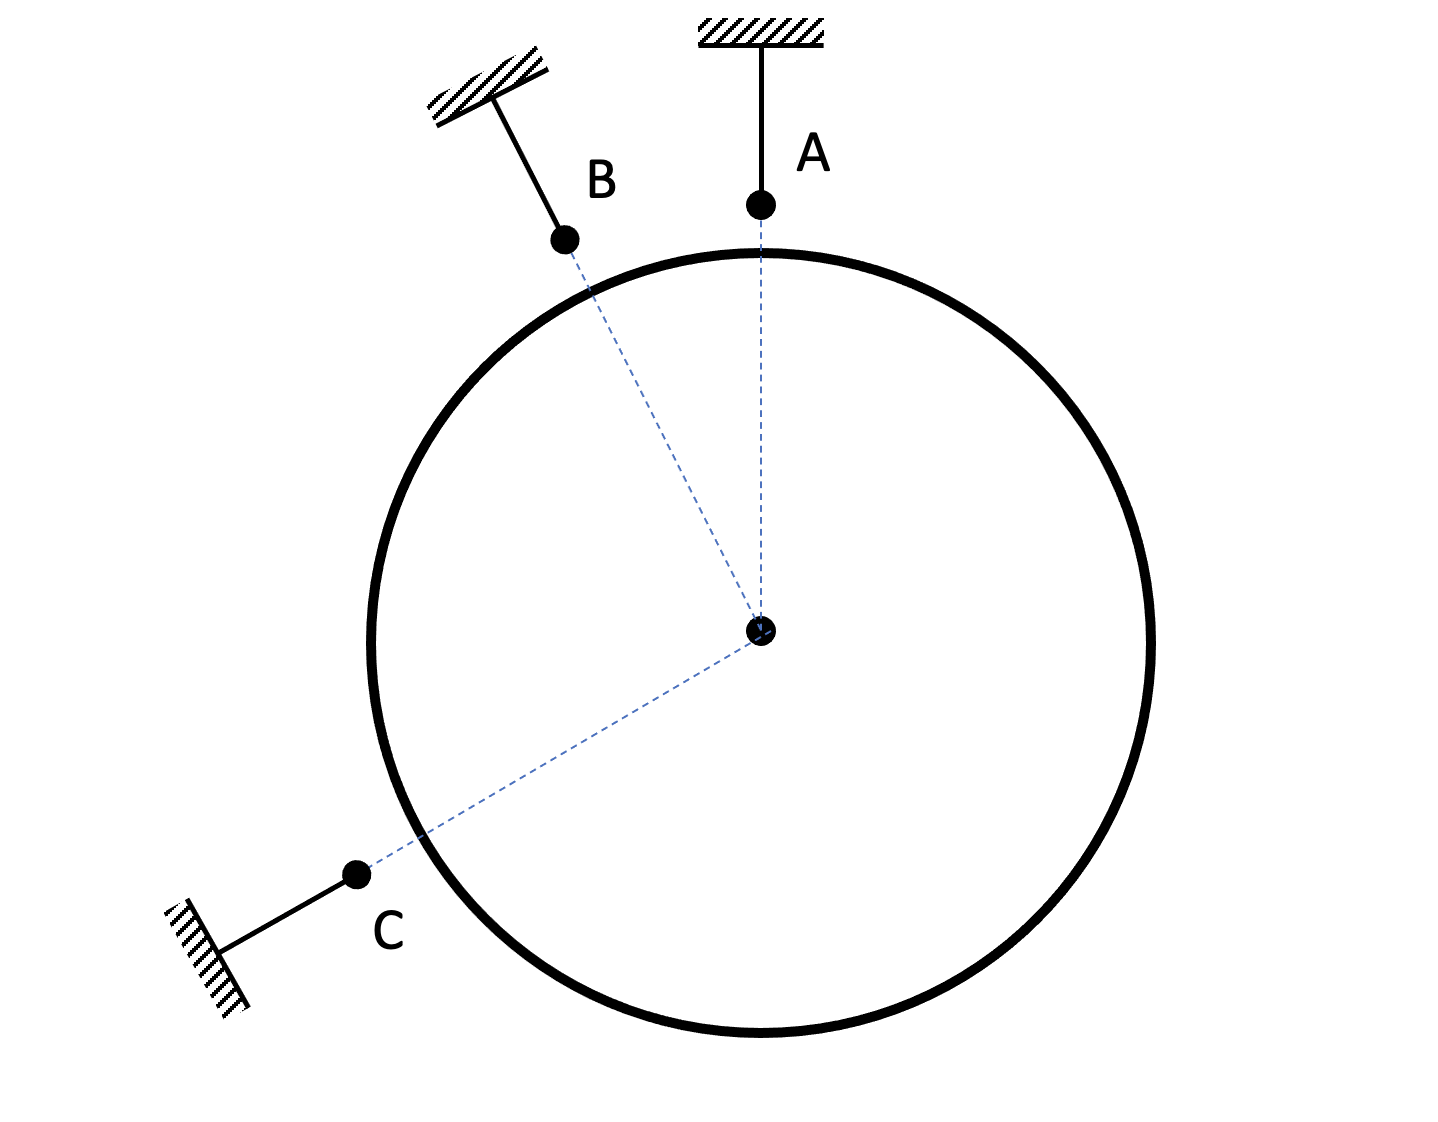
(As a short aside, A and B indicate why the towers of the Humber Bridge are 3.6 cm further apart at the top than they are at the bottom. Take that, flat-earthers!)

The local perpendicular
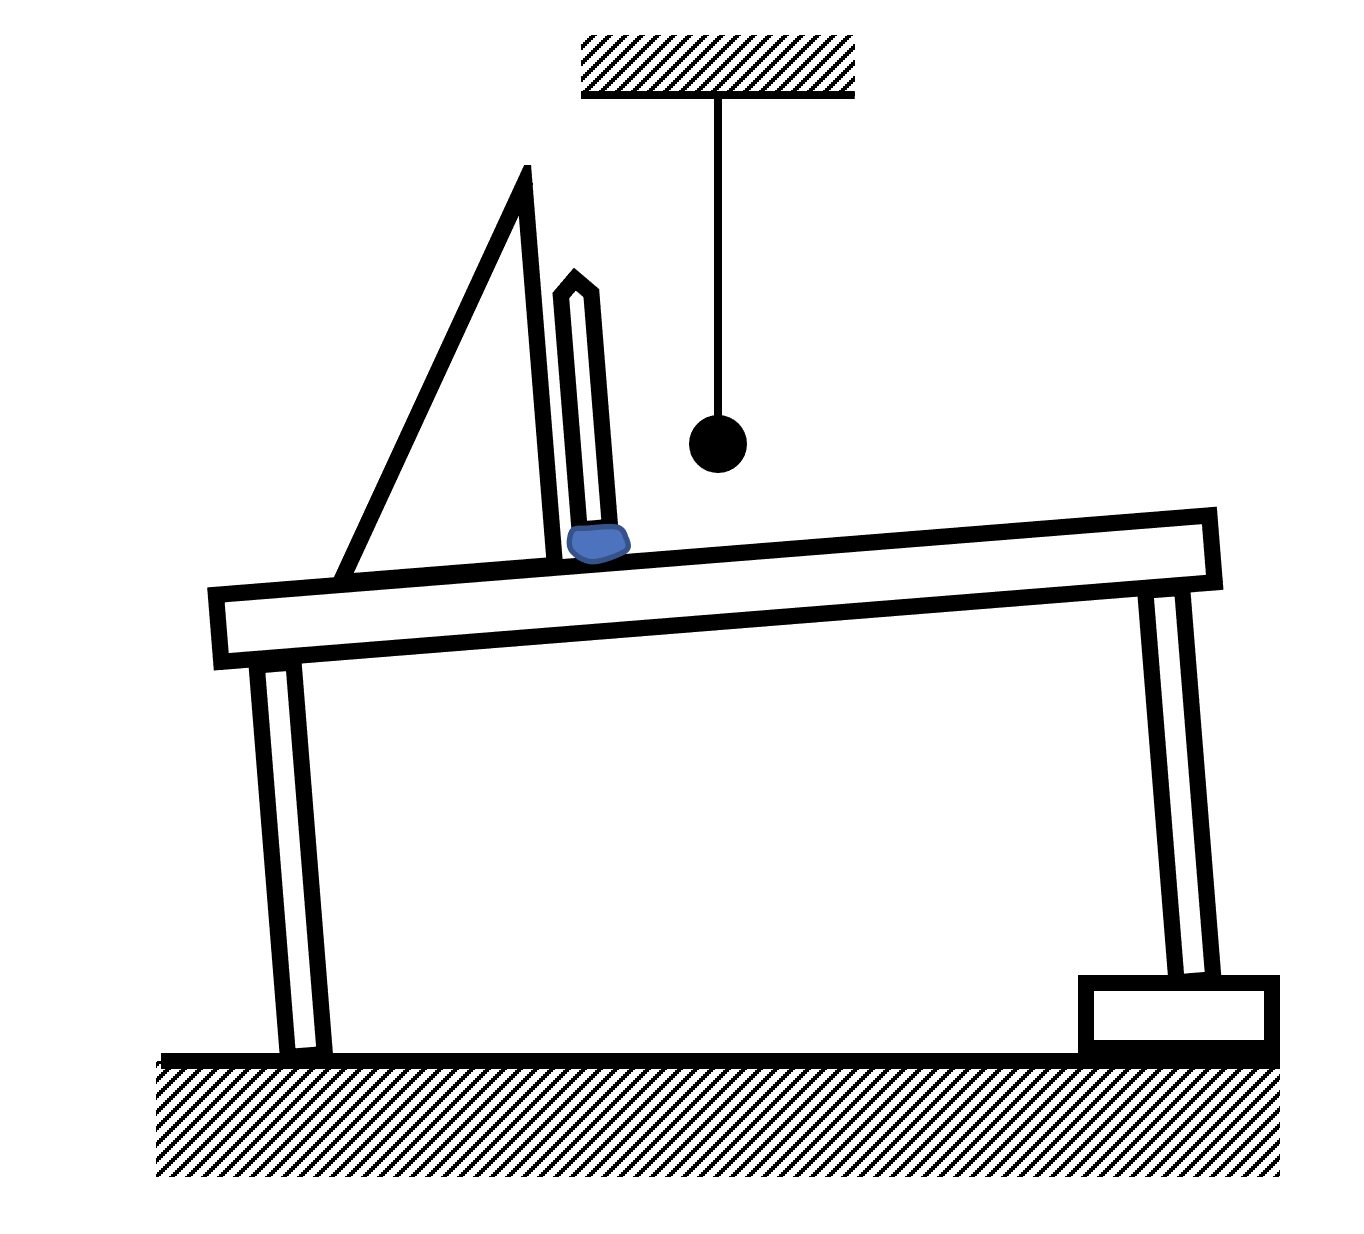
We define the local perpendicular as a line which is at 90o to the plane or surface or table top we are working on. We can find its direction with a set square as shown in the picture below.

Next we tilt the table so that the local perpendicular and absolute vertical are no longer aligned. (Thanks to my colleague Bruce Pawsey for this idea.)
Forces on a dynamics trolley on an inclined plane (GCSE level analysis)
Next we place a dynamics trolley on a horizontal table top. We observe that it is is equilibrium. This is easy to explain if we draw a free body diagram to show the forces on the trolley.
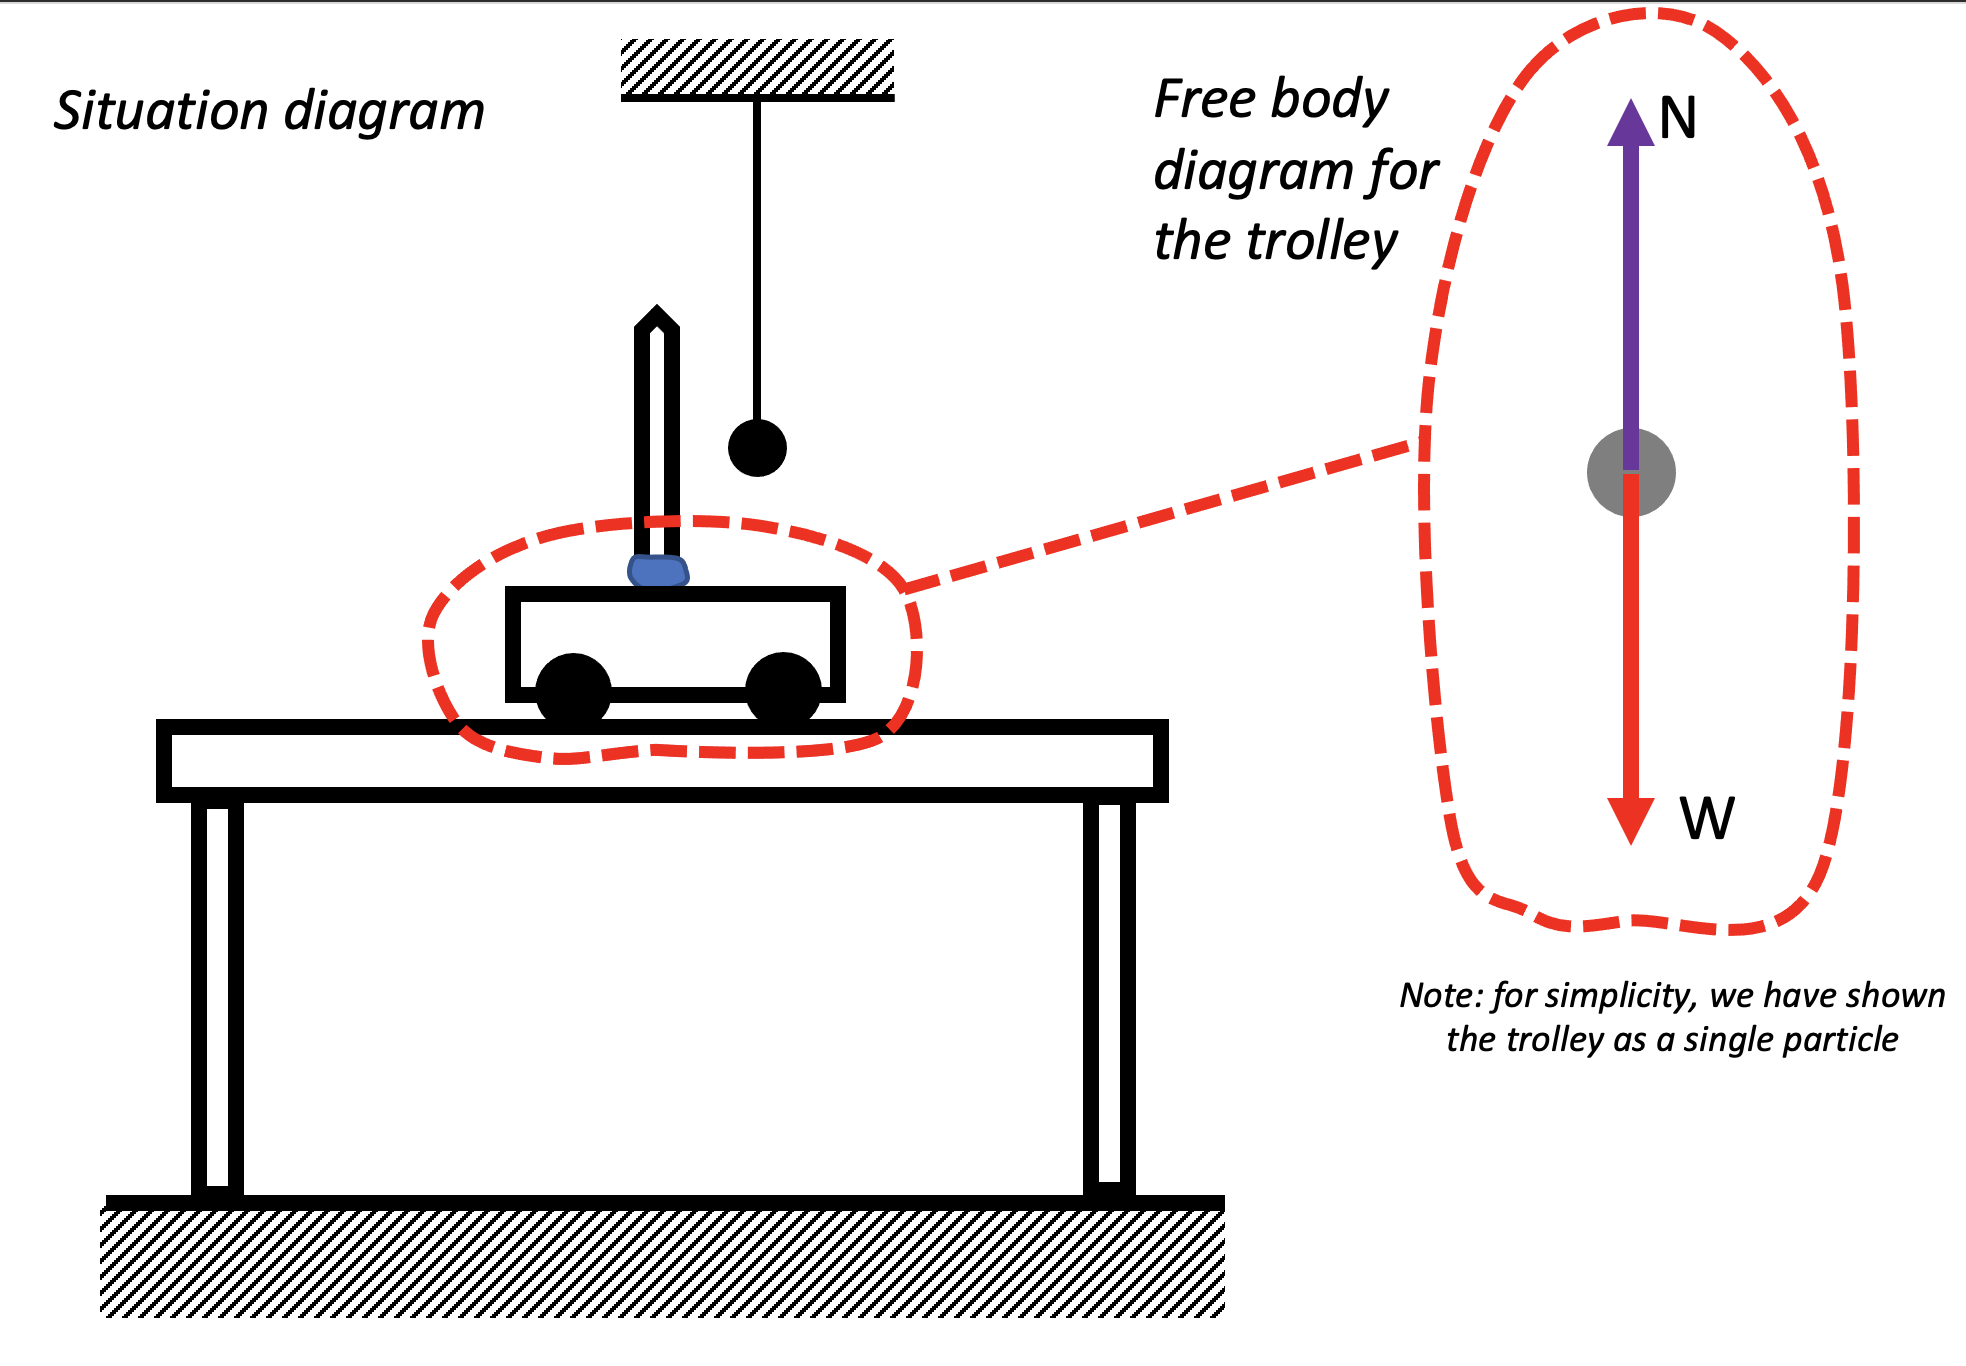
The normal reaction force N on the trolley is equal and opposite to the weight W of the trolley. The resultant (total) force on the trolley is zero so it is not accelerating.
But now note what happens if we tilt the table so that it becomes an inclined plane: the trolley accelerates to the left.

At GCSE, it is probably best to restrict the analysis to what happens in the absolute vertical (shown by the plumb line) and the absolute horizontal (at 90o to the plumb line).
If we resolve the normal reaction force into two components, we see that N has a small horizontal component (see above). This is the resultant force that causes the trolley to accelerate to the left as shown.
Forces on an object on an inclined plane (A level analysis for static equilibrium)
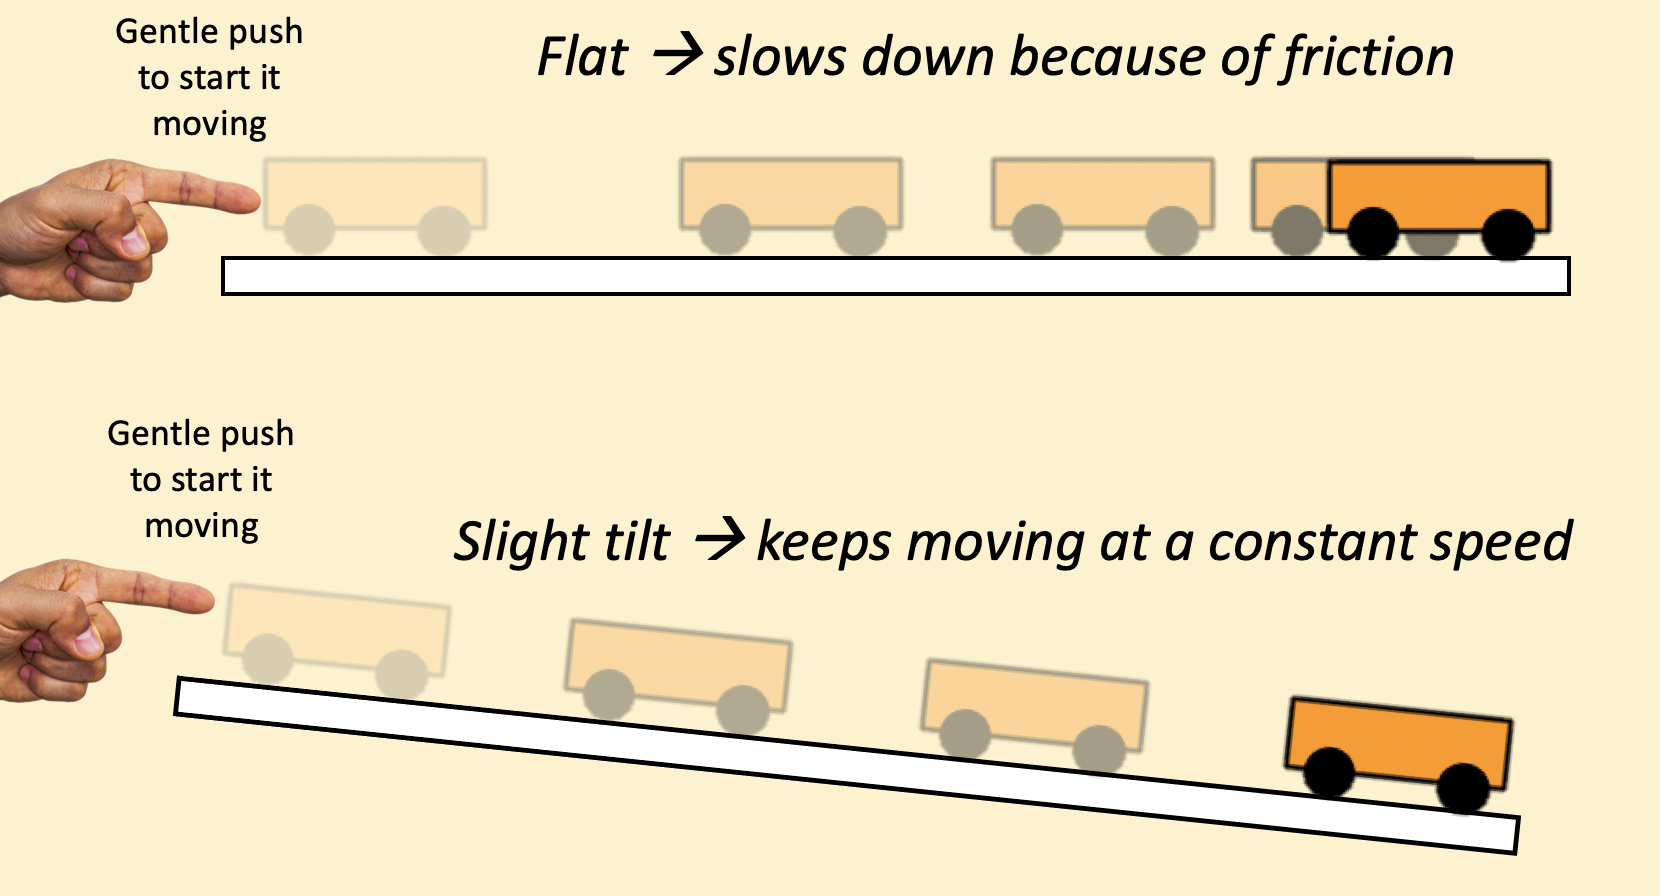
If we flip the trolley so that it is upside down, then there will be a frictional force acting parallel to the slope. This means that, as long as the angle of tilt is not too steep, the object will be in equilibrium.

It now makes sense to resolve W into components parallel and perpendicular to the slope, since it is the only force of the three which is aligned with the absolute vertical. F and W are aligned with the local perpendicular and horizontal to it’s less onerous to use these as the ‘reference’ grid in this instance.
The normal reaction force N is equal to W cos 𝜃 not W and since cos 𝜃 is always less than 1 (for angles other than 90o). If we placed the trolley on some digital scales then the reading on the scales would decrease as we increased 𝜃.
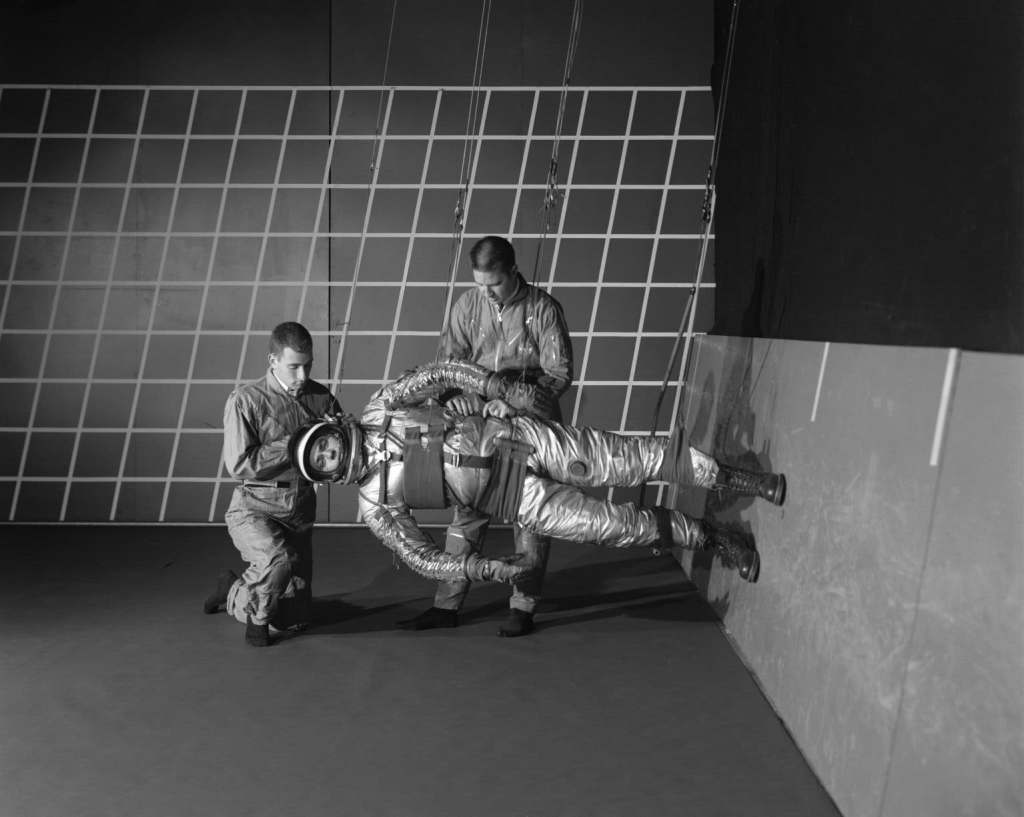
This effect was used to simulate the lower gravitational field strength on the Moon for training astronauts for the Apollo programme. In effect, they trained on an inclined plane. (‘To attain the Moon’s terrain / One trains mainly on an inclined plane.‘)
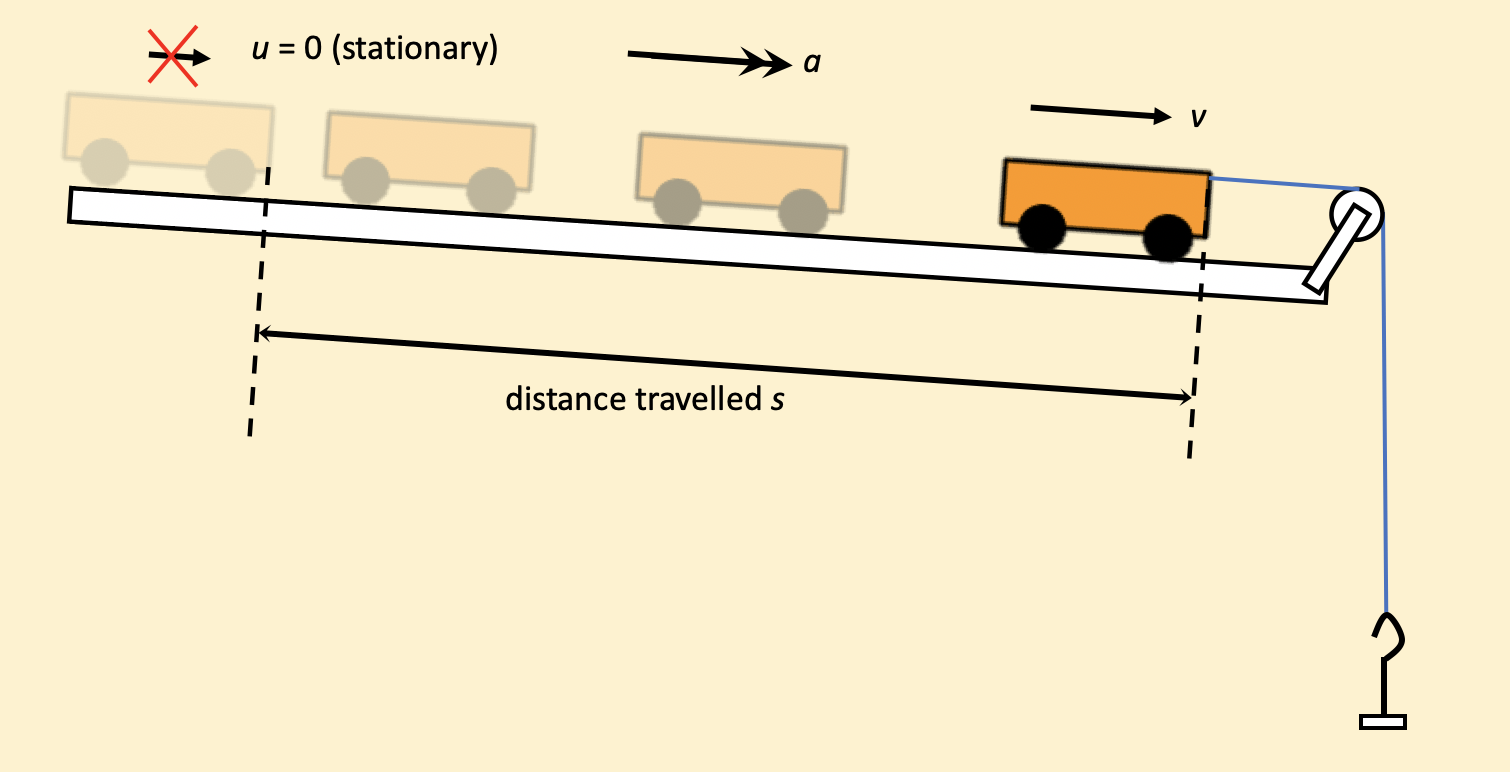
If the wheels of the trolley were in contact with the table surface so that the frictional force were negligible, then the trolley would accelerate down the slope because of the resultant force of W sin 𝜃 parallel to the slope. The direction of the acceleration is parallel to the slope (i.e. at 90o to the local perpendicular) and not along the absolute horizontal as suggested by the earlier, simpler GCSE-level analysis in the previous section.